Every business owner has been told to track their key performance indicators (KPIs). Almost nobody gets told which ones to cut.
The result: businesses that track 30 metrics and act on two of them. Or businesses that track nothing and run on gut feel until something goes wrong. Neither approach gives you what you actually need - a clear, regular picture of whether the business is healthy.
Here is the practical version: five KPI categories, three to five metrics per category, reviewed on a cadence tied to how fast each category changes. That is enough to run a small business on data instead of intuition.
Key takeaways
A small business needs five KPI categories - financial health, sales, customer, operations, and marketing - with three to five metrics each and a review cadence tied to how fast each category changes. Most small businesses can only act on five to 10 core metrics at a time. Tracking more than 25 produces noise, not signal.
- A good KPI changes the decision you make. If a metric moves but you take the same action regardless, cut it.
- Most small businesses can only act on 5-10 core metrics at a time. Track more than 25 and you will track fewer in practice.
- Five categories cover everything: financial health, sales and revenue, customer, operations, and marketing.
- Each category has a natural home in the tools you already use - QuickBooks for financials, Shopify for ecommerce, your CRM for customer metrics.
- Review cadence matters as much as metric selection. Cash flow needs weekly attention. Customer metrics only move meaningfully over months.
Why most small business KPI advice doesn't work
Search "what KPIs should a small business track" and you will find lists. Lots of lists. Some have 10 items. Some have 30. A few ambitious ones have 50.
What you will not find: guidance on how many to track, which ones connect to actual decisions, or what to do when a number moves. The standard approach is to catalog every metric a business could theoretically measure and let the reader figure out what matters.
It doesn't work in practice because the problem isn't knowledge - it's prioritization. A 50-person ecommerce company doesn't need to know that average session duration exists. They need to know whether their cash position can support next month's inventory order, whether their conversion rate has dropped, and whether their top customers are coming back. Everything else is noise.
The framework below cuts the noise. Each category maps to a specific part of the business. Each metric connects to a specific decision. If you cannot name what you would do differently based on a metric's value, it does not belong on your dashboard.
What makes a KPI worth tracking
A KPI - short for key performance indicator - is a number that tells you whether a specific part of your business is healthy. Not every metric qualifies. The test is simple: does this number change what you do next? If the answer is yes, it is a KPI. If not, it is noise.
A vanity metric is one that moves but never changes any decisions. Total page views on your website is a classic example. If page views go up, you keep doing what you are doing. If they go down, you keep doing what you are doing. The number feels informative but produces no action. Compare that to website conversion rate - the percentage of visitors who take a desired action. If conversion rate drops, you test a new headline. You change the page layout. You investigate the traffic source. The metric changes your behavior. That is what makes it worth tracking.
Apply this test to every metric before adding it to your dashboard. "If this number goes up, I will do X. If it goes down, I will do Y." If the answer is the same either way, cut it.
How many KPIs should a small business track
A small business should aim for 15-25 KPIs across five categories - roughly three to five per category. In practice, most teams find they can only act on five to 10 core metrics at a time - the rest accumulate without changing any decisions. Tracking more than 25 means you are collecting data, not using it.
The pressure to track more usually comes from availability, not need. Once you connect your accounting software and your sales platform, dozens of numbers become accessible. Accessible is not the same as actionable. A number you look at weekly and act on quarterly is not a KPI - it is background noise dressed up as a metric.
Start with fewer than you think you need and add from there. It is much easier to add a metric when you have a specific decision it would inform than to cut metrics after building a dashboard around them.
The five KPI categories every small business needs
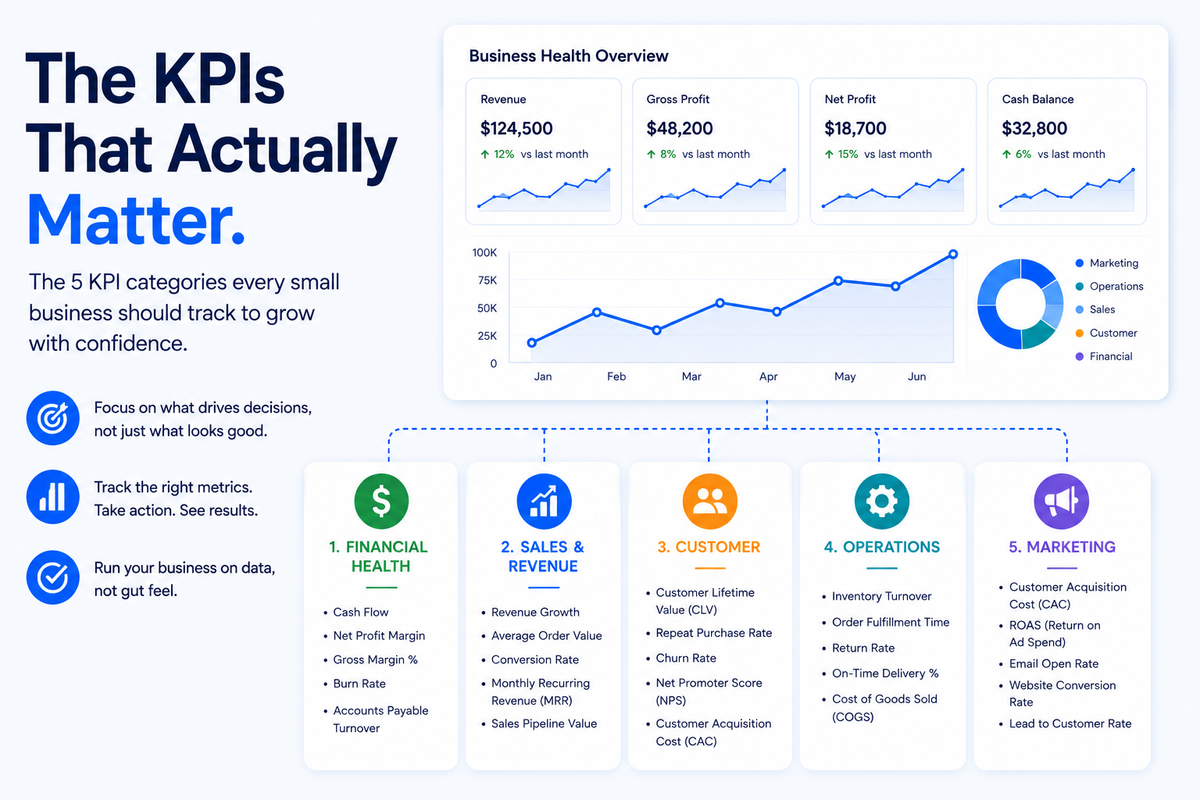
Five KPI categories cover every part of a small business a founder or ops lead needs to monitor: financial health, sales and revenue, customer, operations, and marketing. Track three to five metrics per category and you have a complete, actionable picture of business health without the noise that comes from tracking everything a platform can surface.
Financial health
Financial health KPIs tell you whether the business is viable today and will still be viable next month. Three metrics cover the core: gross profit margin, net profit margin, and operating cash flow. All three are standard reports in QuickBooks or Xero and require no custom setup to access. Review cash flow weekly; margins monthly.
Gross profit margin is revenue minus the direct cost of producing your product or delivering your service, expressed as a percentage. It tells you whether your core offering is profitable before you account for overhead. Net profit margin takes the full picture - revenue minus all expenses. Operating cash flow shows how much cash the business generates from normal operations, separate from one-off sales or financing activity.
Where the data lives: QuickBooks, Xero, or your accounting software produces all three through its Profit and Loss and Cash Flow reports. If you are pre-profit, add burn rate - how much cash the business spends each month - to this category.
Review cadence: cash flow weekly, margins monthly. Cash can deteriorate fast; margins move slowly.
Sales and revenue
Sales KPIs measure whether your revenue engine is working and whether the growth you are seeing is real or fragile. The core set is revenue growth rate (month-over-month is more useful than year-over-year for most small businesses), average transaction value, and sales conversion rate. Review weekly - conversion drops are the kind of problem you want to catch in days.
For product businesses, average order value and cart abandonment rate belong here too. For B2B service businesses, add pipeline velocity - how quickly deals move from first contact to close - if you have enough deal volume to make it meaningful.
Where the data lives: your customer relationship management (CRM) platform if you run a B2B or service business. For ecommerce, Shopify's Analytics dashboard surfaces revenue growth, average order value, and conversion rate without any additional setup.
Review cadence: weekly. Sales numbers move fast and a dropping conversion rate is the kind of problem you want to catch in days, not months.
Customer metrics
Customer KPIs show whether you are acquiring customers efficiently and keeping them long enough to make acquisition worthwhile. The two most important are customer acquisition cost (CAC - how much you spend to win each new customer) and customer lifetime value (LTV - the total revenue a customer generates over their relationship with your business). Neither number alone tells you much. The ratio - LTV divided by CAC - tells the real story. A ratio above 3:1 indicates a sustainable acquisition model. Below 1:1 means you are losing money on every customer you win.
For subscription or SaaS businesses, add churn rate - the percentage of customers who cancel in a given period. For any business that runs surveys or post-purchase follow-ups, a Net Promoter Score or simple satisfaction rating rounds out the category.
Where the data lives: your CRM and billing software. Some ecommerce platforms calculate LTV natively; others require you to combine order history with acquisition channel data.
Review cadence: monthly. LTV and CAC need time to reflect real patterns. A single bad week will not change your LTV meaningfully, but a persistent downward trend over two or three months is a signal worth acting on.
Operations metrics
Operations KPIs vary more by business type than any other category, because "operations" means different things depending on what you sell and how you deliver it. For product businesses, inventory turnover is the core metric. For service businesses, employee utilization rate - billable hours divided by available hours - is the better signal. Review monthly for most businesses; weekly if inventory is time-sensitive.
Inventory turnover measures how many times your average inventory sells through in a year. High turnover means efficient purchasing and strong demand. Low turnover means cash is sitting on a shelf. For service businesses, employee utilization rate tells you whether you have a capacity problem or a demand problem. For businesses that fulfill physical orders, on-time delivery rate tracks whether promises to customers are being kept.
Where the data lives: your inventory management platform, project management tools, or operations software. Some of this data requires manual tracking if you are early-stage.
Review cadence: monthly for most operations metrics, weekly if your business is inventory-sensitive or if you are in an active growth phase where capacity is tight.
Marketing metrics
Marketing KPIs should trace back to revenue, not follower counts. Most small businesses track the wrong marketing numbers - traffic and social metrics that feel important but never inform a real decision. Website conversion rate and cost per lead are the minimum worth tracking. Social followers and raw traffic are not KPIs unless you can show a direct line to pipeline or revenue.
Website traffic and social media followers feel important but they are vanity metrics unless you can show a direct line from that traffic or those followers to pipeline or revenue. The metrics that actually inform decisions: website conversion rate (visitors who take a meaningful action), cost per lead (what you spend across all channels to generate one qualified prospect), and marketing-attributed revenue or lead-to-close rate.
Where the data lives: Google Analytics for website metrics, your ad platforms (Google Ads, Meta) for cost per lead, your CRM for lead-to-close rate.
Review cadence: weekly for active campaigns where you are spending budget and want fast feedback. Monthly for channel-level performance where you are reviewing whether a channel is worth continuing.
How often should you review your KPIs
Review cadence should match how quickly each category changes. Financial and sales metrics need weekly attention because they can shift fast and catching a problem two weeks late matters. Customer and operations metrics move slowly enough that monthly review gives accurate signal without manufactured urgency.
KPIs vs dashboards - the thing most people get wrong
Building a KPI dashboard is not the goal. Making decisions from data is the goal, and the two are related but not the same thing. The most common mistake is treating dashboard completion as a proxy for being data-driven - adding metrics because they are available, not because they connect to specific decisions at specific thresholds.
The most common mistake is treating dashboard completion as a proxy for being data-driven. A business with a beautiful 30-metric dashboard that nobody acts on is no more data-driven than one that tracks nothing. Before you add any metric, define what you will do if it crosses a threshold in either direction. Cash flow drops below four weeks of operating expenses? That triggers a specific response - cut non-essential spending, accelerate collections, or draw on a credit line. If you cannot write that sentence for a metric, it doesn't belong on the dashboard.
A KPI without a decision threshold is just a number with a chart underneath it.
What your data stack probably already tells you
Most of the KPIs in these five categories already live in tools you have. You probably don't need new software to track them.
QuickBooks or Xero holds your financial picture - gross profit margin, net profit margin, and operating cash flow are standard reports in both. Shopify holds your ecommerce sales picture - revenue, conversion rate, average order value, and top products are all surfaced in the Analytics tab. Your CRM holds your customer and sales picture - pipeline velocity, conversion rate, and customer activity. Google Analytics holds your marketing picture - traffic, conversion events, and channel attribution.
The gap is not the data. The gap is getting a unified view across all four without exporting CSVs every week and reconciling them in a spreadsheet. When your QuickBooks and Shopify data live in separate systems, answering a question like "which products have the best margin after returns and COGS?" requires someone to spend half a day combining them manually. That is when spreadsheets stop being enough to track these across your tools.
What to do next with AnalysisGPT
If you have been using QuickBooks for your financials and Shopify for your ecommerce, the data you need is already in those systems. The question is how to connect it and ask questions across both without building a custom dashboard or hiring an analyst.
AnalysisGPT connects directly to both Shopify and QuickBooks. Once connected, you can ask questions in plain English - "What was my gross margin last month by product category?" or "Which customer segment has the highest repeat purchase rate?" - and get answers without SQL (which stands for Structured Query Language, the standard way to query databases), without a data team, and without a dashboard to maintain.
If you want to see what your KPIs look like when your data is actually connected, AnalysisGPT is free for 30 days. Get started at AnalysisGPT.
Frequently asked questions
Common questions about KPI selection for small businesses - what to track, how many to track, and the difference between a KPI and a metric. Each answer is designed to be actionable: the goal is to help you make a decision, with context on why that decision matters.
What is the most important KPI for a small business?
Cash flow is the most important single KPI for most small businesses, because a business can be profitable on paper and still fail if it runs out of cash. Gross profit margin is the second most important, because it tells you whether your core operations are viable before overhead. If you track nothing else, track these two.
How many KPIs should I track?
Three to five per category across five categories gives you 15-25 KPIs total, which is the practical maximum for a small business team. Most teams find they can only act on 5-10 at a time. Start with fewer than you think you need and add specific metrics when you have a specific decision they would inform.
What is the difference between a KPI and a metric?
A metric is any number your business can measure. A KPI is a metric tied directly to a business goal and reviewed on a defined schedule with a clear threshold for action. All KPIs are metrics, but not all metrics are KPIs. Website traffic is a metric. Website conversion rate - tracked weekly and tied to a revenue target - becomes a KPI when you decide what you will do if it drops below a threshold.