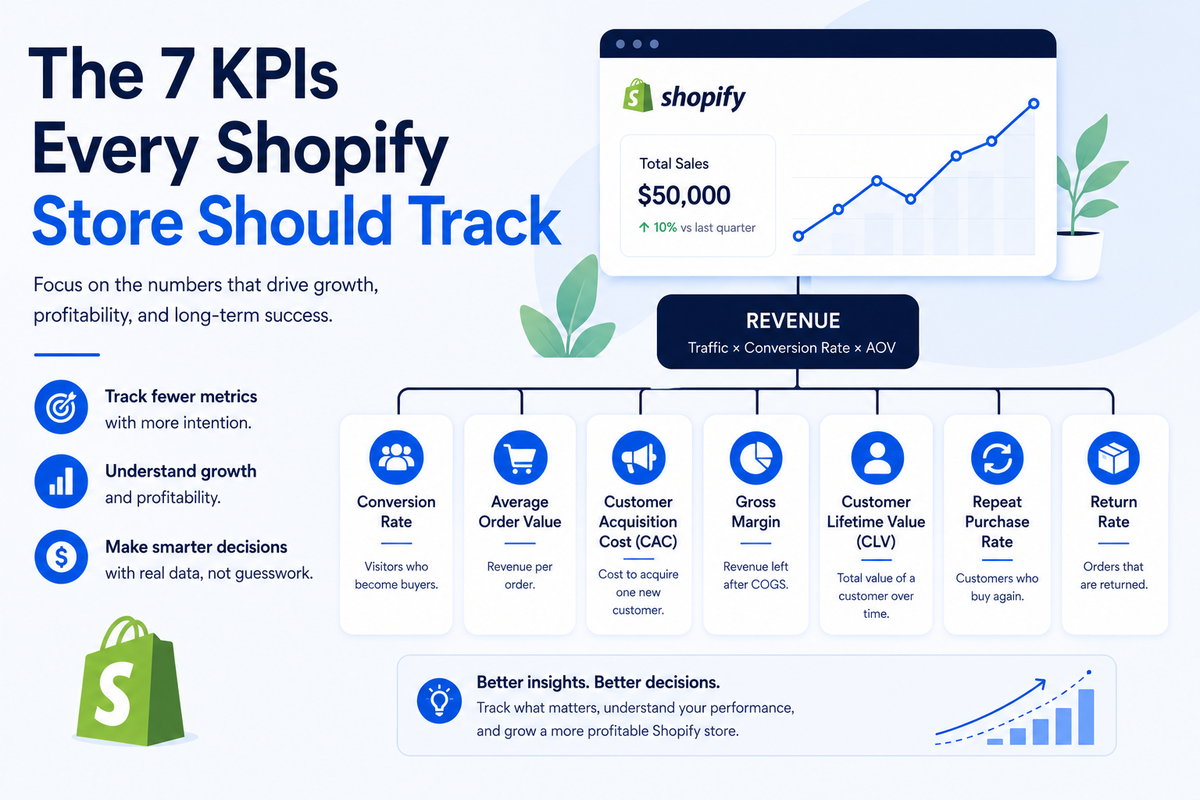
You had a good month. Shopify says $50,000 in sales, up 10% from last quarter. So you increase your ad budget, reorder your best seller, and plan a promotion. Next month the top line looks even better, but your bank balance tells a different story. Shipping costs spiked, returns ate into the best seller's margin, and half that ad spend went to customers who never came back. The revenue number was real. The confidence it gave you outran what the data actually supported.
Shopify gives you built-in dashboards and default reports out of the box. The problem is not a lack of data. The problem is knowing which numbers actually tell you whether your store is healthy, and which ones just make you feel busy.
Key takeaways
- Seven KPIs cover what most Shopify stores need to review weekly. Track fewer metrics with more intention, not more metrics with less context.
- Revenue, conversion rate, and average order value (AOV) explain growth. Gross margin, CAC, CLV, and repeat purchase behavior explain whether that growth is healthy.
- Benchmarks are starting points. Segment by channel, category, device, and customer type before deciding whether a number is good or bad.
- The most common KPI mistake is tracking revenue without subtracting CAC, COGS, shipping, and returns.
- You do not need a data team or a BI tool to track these. A spreadsheet and a weekly review cadence are enough to start.
Think of Shopify performance as a revenue tree. Revenue comes from traffic, conversion rate, and average order value. Profit depends on what it costs to acquire customers, fulfill orders, handle returns, and bring buyers back. The seven KPIs below cover those levers without turning your weekly review into a dashboard audit.
Conversion rate
Conversion rate is the percentage of store visitors who complete a purchase, and it is the single clearest signal of whether your store turns attention into revenue. The formula is straightforward: orders divided by sessions, multiplied by 100.
Blend Commerce's 2026 benchmark guide cites Shopify guidance that typical ecommerce conversion rates sit around 2.5% to 3%, but treat this as a directional benchmark, not a universal target. Blend Commerce is a Shopify CRO agency, and the figure reflects Shopify-specific guidance rather than a published measurement. A store converting at 1.5% with 10,000 monthly visitors leaves roughly 100 extra orders on the table compared to one converting at 2.5%. At a $90 AOV, that gap is $9,000 a month from the same traffic.
The common mistake with conversion rate is comparing your store against a single industry average without segmenting by traffic source. If blog visitors make up 80% of your traffic and those visitors browse without buying, your blended conversion rate looks low even if your paid traffic converts well. Check conversion rate by channel in Shopify Analytics under "Online store conversion rate" with the traffic source filter applied.
How to compute it: Orders / Sessions x 100. Shopify Analytics includes a built-in conversion rate report. Exact location depends on your Shopify plan.
What good looks like: Use 2.5% to 3% as a directional benchmark. Category, device, and traffic source matter more than the blended average. Niche stores with high-intent traffic may outperform the benchmark.
Average order value (AOV)
AOV measures the average revenue per transaction, and raising it is often the fastest way to grow revenue without spending more on ads. The formula: total revenue divided by number of orders.
Shopify stores globally average between $85 and $92 per order as of late 2024, according to Red Stag Fulfillment citing industry benchmarks from Dynamic Yield and Triple Whale Analytics. (Red Stag is a fulfillment vendor with a commercial interest in order-size framing.) Stores in the top quartile push above $109.
Revenue equals traffic multiplied by conversion rate multiplied by AOV. A 15% increase in AOV has the same revenue effect as a 15% increase in traffic, but without additional ad spend.
The pitfall with AOV optimization is pushing aggressive upsells or bundles that inflate the number but increase returns. If your AOV rises from $85 to $110 but your return rate jumps from 8% to 15%, you lost more than you gained. Track AOV alongside return rate and gross margin to see the full picture.
How to compute it: Total Revenue / Number of Orders. Shopify Analytics includes AOV in its default sales reports.
What good looks like: Compare against your category and price point first. $85 to $92 is a useful global reference point, but a beauty brand, furniture store, and luxury jewelry store should not share the same AOV target. The goal is steady improvement through product bundling, free-shipping thresholds, and post-purchase offers, not one-time spikes.
Customer acquisition cost (CAC)
CAC is the total cost to acquire one new customer, and it determines whether your growth is profitable or just expensive. The formula: total marketing and sales spend divided by new customers acquired in the same period.
LoyaltyLion's 2025 analysis cites Shopify internal data via Upcounting suggesting many ecommerce brands sit roughly in the $68 to $78 CAC range, but the source treats this as a broad ballpark, not a target. Because this is a vendor-published benchmark, use it directionally rather than as a target. CAC has been climbing: LoyaltyLion reports it rose about 40% between 2023 and 2025, driven by rising ad costs and increased competition for attention.
The biggest mistake with CAC is calculating it on a blended basis that averages paid and organic channels together. A blended CAC of $70 might hide the fact that your Google Ads channel costs $120 per customer while your email list costs $8. One is profitable at your AOV. The other is not. Break CAC out by channel, and compare each channel's CAC against AOV and first-order margin.
How to compute it: (Total Marketing Spend + Sales Spend) / New Customers Acquired. Shopify does not calculate CAC natively. You need to pull ad spend from your ad platforms (Meta, Google, TikTok) and divide by the new-customer count from Shopify's customer reports.
What good looks like: CAC below your first-order gross profit. If your gross margin on a $90 order is $45, a $70 CAC means you lose money on the first purchase and depend on repeat orders to break even.
Customer lifetime value (CLV)
CLV estimates the total revenue a customer generates over their full relationship with your store, and it answers the question that CAC alone cannot: is this customer worth what you paid to acquire them? The formula: AOV multiplied by purchase frequency multiplied by average customer lifespan.
A store with a $90 AOV, two purchases per year, and a three-year average customer lifespan has a CLV of $540. Compare that to a $70 CAC and the math looks comfortable. But the math only holds if the retention assumptions are real.
A common failure mode is using projected CLV to justify paid acquisition before repeat-purchase data exists. Many direct-to-consumer brands spent aggressively on paid acquisition only to find customers did not return after the first purchase. If your store's repeat purchase rate is 15%, a CLV projection based on three annual purchases is fiction.
Validate CLV against actual repeat purchase data. Pull your 90-day and 180-day repurchase cohorts from Shopify's customer reports before using CLV to set your CAC budget.
How to compute it: AOV x Purchase Frequency x Customer Lifespan. Shopify offers customer segmentation features that include predicted spend data, but building a simple cohort in a spreadsheet gives you more control over assumptions.
What good looks like: Many operators use 3:1 as a rough CLV-to-CAC target, but the real test is payback period and cash flow. If you need three years of repeat purchases to justify this month's ad spend, the ratio is less useful than it looks. Treat 3:1 as directional, not universal.
Cart abandonment rate
Cart abandonment rate measures the share of shopping carts that do not convert to completed orders, and most Shopify stores see far more abandonment than actual lost revenue. About 70% of online shopping carts are abandoned before checkout, according to Baymard Institute's 2025 meta-analysis of 50 studies. That figure needs context before you act on it.
Baymard's 2025 survey of over 1,000 US adults found that 43% of shoppers who abandoned a cart were "just browsing" or not ready to buy. Cart abandonment is not all lost revenue. A large portion reflects natural browsing behavior: price comparison, wish-listing, and saving items for later. Treating every abandoned cart as a fixable problem leads to aggressive email sequences that annoy browsers and erode trust.
The formula: 1 minus (completed orders divided by carts created), multiplied by 100. Shopify includes cart analysis in its analytics reports.
Focus recovery efforts on abandonment reasons you can influence: unexpected costs, checkout friction, forced account creation, trust concerns, delivery speed, returns policy, and site errors. The browsers were never customers yet, but checkout friction is fixable.
How to compute it: (1 - Completed Orders / Carts Created) x 100.
What good looks like: Treat the industry average as context, not a target. A rate meaningfully below the ~70% benchmark is a good sign, but trend matters more than the absolute number. A rising abandonment rate after a site change signals a checkout friction problem.
Gross profit margin
Gross profit margin is the percentage of revenue left after subtracting the direct cost of goods sold, and it is the metric that separates stores making money from stores moving money. The formula: (revenue minus COGS) divided by revenue, multiplied by 100.
Many Shopify store owners track top-line revenue without subtracting product costs, shipping expenses, and returns. Forum discussions on Reddit's r/shopify_hustlers describe store owners reporting "six figures" in revenue while operating at a loss after ad spend, fulfillment, and refunds. Revenue without margin context is a vanity metric.
COGS (cost of goods sold) for a Shopify store includes product cost, inbound shipping, packaging, and any per-unit fulfillment fees. If you use Shopify's "Cost per item" field, Shopify can show cost and margin context in product reporting, depending on your analytics setup and plan. Many store owners skip this field, which means Shopify reports revenue without cost context.
How to compute it: (Revenue - COGS) / Revenue x 100. Fill in the "Cost per item" field on each product in Shopify Admin > Products.
What good looks like: Healthy gross margin depends on category and fulfillment model. The useful test is whether gross profit can cover CAC, shipping, returns, payment fees, and operating costs while leaving room for profit. If gross margin is falling while revenue rises, pause before increasing ad spend.
Returning customer rate
Returning customer rate is the percentage of orders placed by buyers who have purchased before, and a rising rate is one of the strongest signals that your product and experience hold up after the first sale. Many ecommerce benchmark sources put healthy repeat purchase rates somewhere around the 20% to 30%, but category matters more than the blended average.
Shopify Analytics and customer reports include returning-customer data. Exact report availability depends on your Shopify plan and analytics version.
The pitfall is treating repeat purchases as proof of loyalty when they are driven entirely by deep discounts. If your repeat buyers only return during sales events and your average discount on repeat orders is 30%, the returning customer rate overstates the health of your retention. Segment repeat customers by whether they bought at full price or on promotion. Full-price repeats are loyal. Discount-only repeats are price-sensitive.
How to compute it: Returning Customer Orders / Total Orders x 100.
What good looks like: Many ecommerce benchmark sources put healthy repeat purchase rates somewhere around the 20% to 30% range, but category matters. Consumables and subscriptions should expect more repeat purchase activity than one-time purchase categories. If your rate is below 15%, your CAC math depends entirely on one-time buyers, and that is expensive growth.
How to set up tracking without a data team
You do not need an analyst or an enterprise dashboard to track seven KPIs. The right setup depends on where your store is today and how many data sources feed into your decisions.
Shopify reports and a weekly spreadsheet
Shopify's built-in analytics cover conversion rate, AOV, cart abandonment, and returning customer rate out of the box. For CAC, add a column to a Google Sheet with your weekly ad spend pulled from each ad platform (Meta, Google, TikTok). For gross margin, add a second column with your COGS per order pulled from supplier invoices or your product cost-per-item field in Shopify. Review all seven numbers at the same time each week. A consistent 15-minute weekly review of these metrics gives you more clarity than a real-time dashboard you never check.
Stores that run ads before tracking is solid often waste budget on channels they cannot measure. Start with tracking, then scale spend. The goal at this stage is not perfect data. The goal is a weekly habit of reviewing seven numbers and noticing when one of them moves.
When this fits: Solo operators and early-stage stores with one to two traffic sources and straightforward product economics.
When it falls short: Once you run three or more ad channels, the manual data-pull step starts eating 30 minutes or more per week. If your weekly review consistently requires pulling numbers from Meta, Google, and Shopify into separate tabs before you can answer a basic question, the manual approach is costing more time than it saves.
Connected spreadsheets with scheduled exports
Google Sheets with Shopify data exports and a scheduled review cadence adds structure without adding cost. Use Shopify's CSV exports or a connector like Supermetrics or Coupler.io to pull weekly snapshots into a shared sheet. Build a simple dashboard tab with conditional formatting to flag when a KPI moves outside your target range.
Add columns for channel-level CAC by pulling spend data from Meta Ads Manager, Google Ads, and any other paid channels. Compare each channel's CAC against your first-order gross margin to find where your ad dollars actually earn a return. The key advantage over Tier 1 is that multiple team members can review the same numbers without each person pulling their own version.
When this fits: Stores with three or more ad channels, a small team reviewing data together, or anyone who has outgrown manual data pulls but does not need real-time monitoring.
When it falls short: Spreadsheet connectors break when APIs change, and historical data requires manual backfills. If you find yourself spending more time maintaining the sheet than reading it, or if your questions require combining data from Shopify, your ad platform, and your email tool in a single query, a connected analytics tool is the next step.
Connected analytics tools
Pulling numbers from four or more tools into a single spreadsheet each week becomes its own job. Connected analytics tools solve this by pulling from multiple sources automatically and letting you ask questions across systems without manual exports or reconciliation.
Tools in this layer solve different jobs. Triple Whale focuses on ad attribution, Lifetimely on LTV and cohort analysis, Polar Analytics on unified ecommerce reporting, and AnalysisGPT on plain-English questions across connected business data. Some require dashboards. Others let you type a question and get an answer directly. Pricing ranges widely: some tools offer free tiers or low-cost entry plans, while more advanced attribution and BI platforms can run hundreds of dollars per month or require custom pricing.
When this fits: Stores running four or more data sources, operators who want to ask questions ("What was my CAC on Meta last month for customers who reordered?") instead of building reports, and teams that need a shared source of truth without a data warehouse.
When it falls short: If your store has one traffic source and simple product economics, a connected tool adds cost without adding insight. Start with Tier 1 and move up when the manual approach stops scaling.
How to know which metrics matter for your stage
Not all seven KPIs deserve equal attention at every stage. These four questions help you decide where to focus your weekly review.
Are you still validating product-market fit? If yes, conversion rate and CAC are your primary focus. A low conversion rate at this stage means your offer or positioning needs work before you spend on traffic. If no, your fundamentals are solid and your attention should shift to margin and retention.
Are you scaling ad spend? If yes, watch CAC by channel and compare it to first-order gross margin weekly. A rising blended CAC often hides one unprofitable channel dragging the average up. If no, your growth comes from organic sources and CAC tracking can happen monthly.
Are you optimizing for profitability? If yes, gross profit margin and CLV are the metrics that matter most. Revenue growth without margin improvement is not progress. If no, you may still be in a growth-first phase where CAC and conversion rate take priority.
Is your CLV-to-CAC ratio above 3:1? If yes, your unit economics support scaling. If no, focus on either reducing CAC (better targeting, channel pruning) or increasing CLV (retention, AOV growth, reducing churn).
AnalysisGPT is one option in the connected analytics layer if you want to ask plain-English questions across Shopify, spreadsheets, databases, and other connected sources. If your weekly KPI review has turned into manual exports and spreadsheet reconciliation, explore AnalysisGPT at analysisgpt.ai.