Power BI alternatives for non-technical teams
Power BI is built for organizations with dedicated data modelers, analysts fluent in DAX, and IT teams managing on-prem gateways. Most SMBs searching for alternatives don't have those resources. They have a founder toggling between QuickBooks and Google Sheets, an ops lead pulling Monday-morning numbers by hand, and a finance manager who needs answers, not another learning curve.
Eight tools evaluated here through a single lens: can a non-technical team get from raw data to business insight without filing a ticket or writing a formula? The criteria favor natural-language queries, browser-based collaboration, transparent pricing, and time-to-first-insight measured in minutes, not sprints.
Key takeaways
- AnalysisGPT is a strong fit for SMB teams that want conversational, plain-English analytics across multiple data sources without writing formulas or learning a query language.
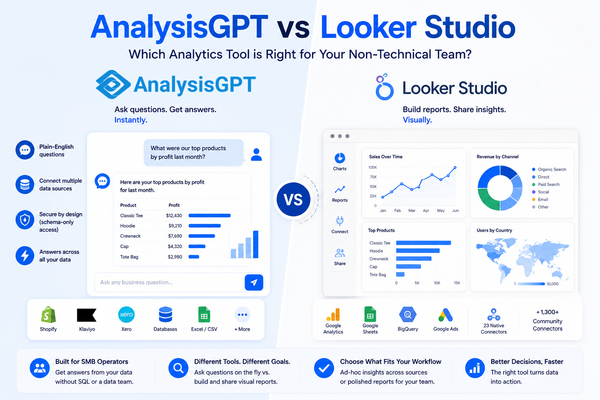
- Looker Studio is a good fit for teams already inside the Google ecosystem who need free, shareable dashboards over Google Analytics, Sheets, and BigQuery data.
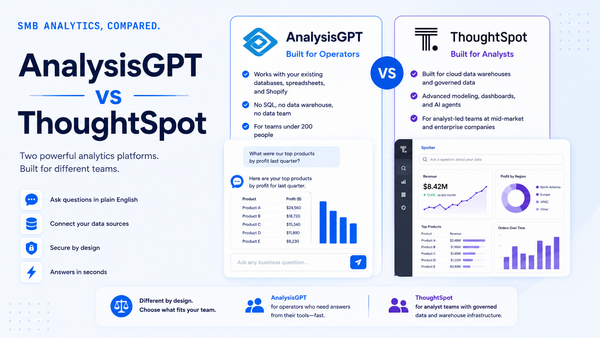
- ThoughtSpot suits mid-market teams that want search-driven exploration with governed data models and enterprise-grade permissions.
- Metabase appeals to small teams with a technical co-founder or developer on staff who prefer open-source tooling and SQL-optional exploration.
- Stay with Power BI if your team already includes a proficient DAX user, you rely on deep Excel integration, or your organization standardizes on Microsoft Fabric.
Why Power BI frustrates non-technical teams
Power BI is a capable platform, but its design assumes a technical operator sits between the data and the decision-maker. Three friction points show up repeatedly in SMB teams that lack that resource.
DAX creates a bottleneck
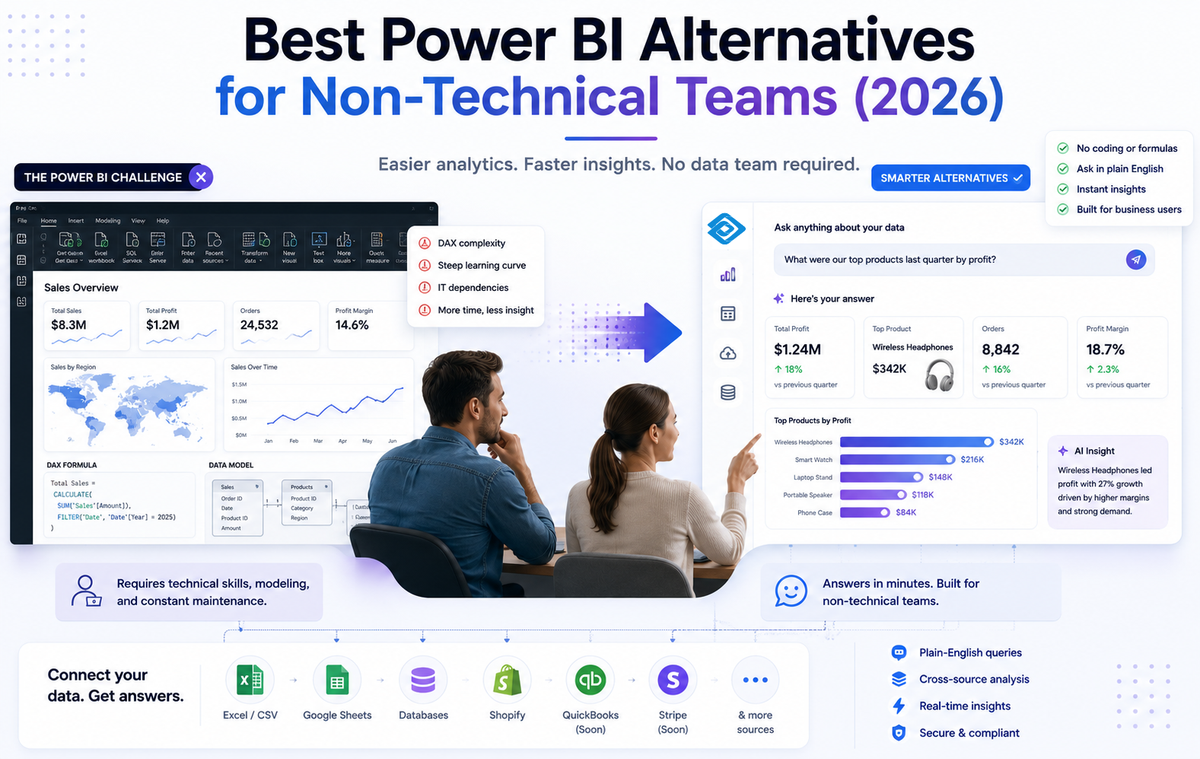
DAX, Power BI's formula language, controls nearly every calculated metric, filter context, and row-level security rule inside a report. Learning it requires understanding evaluation contexts, iterator functions, and a syntax closer to programming than to spreadsheet formulas. DAX is one of the most frequently cited frustrations on G2, Capterra, and Gartner Peer Insights.
The practical result: only one or two people on a team can build or modify reports. Every new business question turns into a queue item. A marketing manager who wants to see cost-per-lead by channel waits for the analyst to write a CALCULATE/FILTER pattern, test it, and publish. That turnaround can take days in a small team where the analyst wears other hats.
Licensing tiers confuse small teams
Power BI licensing includes Free, Pro, Premium Per User, and Fabric capacity tiers. Pro costs $14 per user per month. Premium Per User costs $24 per user per month. The free tier restricts publishing and sharing.
Sharing dashboards externally or across workspaces requires every viewer to hold at least a Pro license. A five-person team sharing reports with 10 department heads now needs 15 Pro seats, not five. Costs climb quickly and unpredictably, especially for SMBs budgeting quarterly. Fabric capacity pricing adds another layer of complexity with compute-based billing that penalizes bursty, ad hoc usage patterns common in smaller organizations.
Desktop-first workflow limits collaboration
Power BI Desktop, where most report authoring happens, runs only on Windows. Mac users are limited to the web service, which lacks the full modeling and visualization toolset available in Desktop. Teams split across operating systems end up with a two-tier authoring experience.
Reports built in Desktop are saved as .pbix files. Sharing them typically means emailing files or uploading to a workspace manually. Version control is informal at best. Two people editing the same report risk overwriting each other's changes. Browser-based BI tools solve this by default: everyone works on the same live version, edits sync automatically, and there is no file to misplace. For a three-person ops team, the .pbix workflow adds friction that a shared, browser-native workspace eliminates.
What to look for in a Power BI alternative
Four factors separate analytics tools that work out of the box from tools that need weeks of configuration: ease of use, data connections, pricing transparency, and AI capabilities.
Ease of use and time to first insight
A useful analytics tool should give a non-technical person an answer within 10 minutes of uploading data. Power BI requires data modeling, relationship building, and DAX formulas before a single chart appears. Many alternatives skip that setup entirely and let users drag, drop, or type a question to see results immediately.
Look for tools that let you upload a CSV or connect a database and start asking questions right away. If the platform requires a training course before your team can do anything useful, it's adding overhead you don't need. The goal is faster answers, not more software to learn.
Data connections
Your analytics tool needs to connect to the systems you already run. QuickBooks, Shopify, Google Sheets, Excel files, and SQL databases cover most SMB data sources. Some tools offer native connectors that pull data in directly. Others require ETL pipelines or third-party middleware to move data into a warehouse first.
Native connectors save time and reduce the number of tools in your stack. ETL-based approaches add cost, complexity, and lag between when data changes and when it shows up in reports. Ask whether the tool connects to your specific sources out of the box, and whether those connectors require technical configuration.
Pricing transparency
Monthly cost should be predictable before you sign up. Some tools charge per seat, others charge based on data volume or query count, and a few offer free tiers with meaningful functionality. Power BI's pricing starts at $14 per user but scales quickly once you factor in Premium capacity, gateway management, and admin time.
Watch for hidden costs: onboarding, training, dedicated admin staff, and infrastructure fees. A $14 per-seat tool that requires a $2,000 gateway and 20 hours of setup time costs more than the sticker price suggests.
AI and natural language capabilities
Conversational analytics tools let business users ask questions in plain English instead of writing formulas or building dashboards. In 2025 and 2026, AI features have moved from experimental add-ons to core product capabilities: search-driven queries, AI agents that build visualizations, and natural language interfaces that replace the query builder entirely.
These features matter most for non-technical users. A tool with strong natural language support lets an ops lead type "what were our top-selling products last quarter" and get a chart back, without waiting for an analyst. Evaluate whether the AI features work with your connected data or only with pre-modeled datasets.
AnalysisGPT
Who it works for: SMB founders, operators, and data-curious managers without technical staff or data teams.
Best for analyzing: Cross-source business data from databases, Excel files, and connected platforms like Shopify.
Power BI is a reporting platform built for teams with modeled data and technical staff. AnalysisGPT is conversational analytics built for operators who want answers in plain English. AnalysisGPT connects directly to business data, lets users ask questions in plain English, and returns clear answers without SQL, ETL, or dashboard setup.
Security follows a split architecture: the model sees the schema (table names, column names, data types) but never the actual data. A separate read-only connection executes queries against the customer's system. AnalysisGPT holds SOC 2, ISO 27001, ISO 42001, and GDPR compliance.
Key features and functions:
- Natural language queries across connected data sources
- Cross-source analysis combining multiple systems in one workspace
- Native Shopify integration with QuickBooks and Square in progress
- Real-time dashboards generated from conversational queries
- Excel and CSV file upload for instant analysis
Shopify is the only live native SMB integration today; QuickBooks and Square are in progress. Teams needing live connections to dozens of SaaS tools will want to check the current integration list before committing. Database connections and Excel/CSV upload cover the primary data ingestion paths for most SMB use cases.
Pricing: £0 Trial / £20 Excel plan / £90 Pro plan, billed every 30 days. The Excel plan covers file-based analysis; the Pro plan adds connected data sources.
Try AnalysisGPT free. Upload an Excel file and ask your first question in minutes.
Looker Studio
Who it works for: Marketing teams and small businesses already using Google Analytics, Google Ads, or Google Sheets.
Best for analyzing: Marketing performance, website traffic, ad spend, and Google Sheets data.
Looker Studio is 100% free with no per-seat costs, making it one of the most accessible BI tools for small teams. Google ecosystem integration is native, and the platform supports hundreds of data connectors including community-built options. A drag-and-drop interface and real-time collaboration make it easy for marketing teams to build and share reports. Google has announced Gemini integration for Looker Studio, with AI-generated reports and chart suggestions expected to roll out through 2026.
Key features and functions:
- Free, unlimited dashboards and reports with no seat limits
- Native Google Analytics, Google Ads, and Google Sheets connectors
- Drag-and-drop report builder with real-time collaboration
- Hundreds of community connectors for non-Google data sources
- Gemini AI features for chart and report suggestions (announced, rolling out 2026)
Data modeling capabilities are limited compared to full BI platforms. AI features are still emerging as Gemini integration rolls out. Looker Studio is not a strong fit for complex multi-source analysis or data environments outside the Google ecosystem.
Pricing: Free.
ThoughtSpot
Who it works for: Mid-market teams wanting self-service analytics without building dashboards.
Best for analyzing: Operational data stored in cloud data warehouses.
Search-driven analytics define ThoughtSpot's approach. Business users type questions into a search bar and get visual answers back. Spotter, ThoughtSpot's AI Agent, extends this with agentic analytics that can proactively surface insights and build analyses from conversational prompts. The experience is designed to feel closer to a search engine than a dashboard builder.
Key features and functions:
- Search-driven query interface for business users
- Spotter AI Agent for agentic, conversational analytics
- Live connections to cloud data warehouses (Snowflake, BigQuery, Databricks, Redshift)
- AI-generated insights and automated monitoring
- Embeddable analytics for product teams
ThoughtSpot requires a connection to a cloud data platform, which means teams need an existing data warehouse before they can use the tool. Enterprise-oriented pricing ($25/user/month for Essentials) may be steep for small teams with limited budgets. ThoughtSpot is strongest for organizations that already operate a cloud data warehouse and want to give business users a self-service layer on top of it.
Pricing: Essentials starting at $25/user/month billed annually.
Metabase
Who it works for: Cost-sensitive teams with someone technical enough to handle initial setup.
Best for analyzing: Database-connected operational data with SQL-optional exploration.
Open-source and free to self-host, Metabase gives teams full analytics capabilities at zero software cost. A visual query builder lets non-technical users explore data by clicking through tables, filters, and groupings instead of writing SQL. Metabot AI adds an AI-assisted analysis layer that helps users ask questions in natural language and generate charts from conversational input.
Key features and functions:
- Free, open-source self-hosted edition with full feature set
- Visual query builder for SQL-free data exploration
- Metabot AI for natural language questions and AI-assisted analysis
- Native connectors for PostgreSQL, MySQL, BigQuery, and other popular databases
- Embeddable charts and dashboards for internal tools
The self-hosted edition requires someone to install, configure, and maintain the instance, including server provisioning, updates, and database backups. Cloud-hosted plans are available but pricing is not publicly listed, so teams need to contact Metabase for a quote.
Pricing: Free (self-hosted open source); cloud plans contact for pricing.
Tableau
Who it works for: Teams with at least one analyst who can prepare data models and build dashboards for others to consume.
Best for analyzing: Mid-size to enterprise teams that prioritize visual storytelling and already have clean, structured data pipelines.
Tableau is the visualization benchmark in business intelligence, with a drag-and-drop interface that produces polished, interactive charts from hundreds of data sources. The 2026 release of Tableau Agent adds AI-powered analysis and natural language querying to the platform.
Key features and functions:
- Drag-and-drop chart builder with hundreds of visualization types
- Connects to hundreds of data sources, including cloud databases, spreadsheets, and APIs
- Tableau Agent (2026) enables natural language questions and AI-assisted analysis
- Embeddable dashboards for internal and external sharing
Tableau's power comes with a learning curve. Someone on your team still needs to prepare the data and design dashboards before anyone else can explore them. The tool rewards analyst-driven workflows, which means non-technical users depend on others to get started.
Pricing: Tableau Standard starts at $15 per user per month. Enterprise plans run $35 per user per month, with additional costs for Tableau Cloud or Server infrastructure.
Sigma Computing
Who it works for: Organizations that already run a cloud data warehouse and want to give business users direct, governed access to it.
Best for analyzing: Finance and operations teams at mid-market or enterprise companies who think in spreadsheets but need to query large datasets in Snowflake, Redshift, BigQuery, or Databricks.
Sigma Computing brings a spreadsheet-style interface to live data warehouse queries. Teams familiar with Excel can write formulas, build pivot tables, and create charts directly on top of warehouse data without learning SQL.
Key features and functions:
- Spreadsheet interface that runs calculations on live warehouse data
- Native connectors for Snowflake, Redshift, BigQuery, and Databricks
- Version control and row-level security for governed self-service
- Embeddable analytics for customer-facing use cases
Sigma requires a cloud data warehouse to function. Teams without an existing warehouse investment need to set one up first, which adds cost and technical overhead. Pricing is custom and enterprise-oriented, so smaller teams may find it hard to evaluate costs upfront.
Pricing: Custom pricing. Contact Sigma for a quote.
Domo
Who it works for: Teams that want a single platform for data pipelines, dashboards, and collaboration without stitching together multiple tools.
Best for analyzing: Mid-market companies with diverse data sources that need both self-service dashboards and automated data workflows.
Domo is an all-in-one BI platform that combines data integration, visualization, and AI-powered analysis in a single cloud product. It connects to over 1,000 data sources and includes AI chat plus the ability to build custom AI agents for specific business workflows.
Key features and functions:
- Over 1,000 pre-built connectors for cloud apps, databases, and files
- AI-powered chat interface and custom AI agent builder
- Built-in ETL and data transformation layer
- 30-day free trial to test the full platform
Domo uses consumption-based pricing, which makes it difficult to predict monthly costs before committing. The platform is feature-rich, but that breadth can feel overwhelming for small teams with simple reporting needs.
Pricing: Consumption-based pricing. A 30-day free trial is available. Contact Domo for a quote.
Anomaly AI
Who it works for: Analysts and data-curious team members who want fast answers from connected data sources without building full dashboards.
Best for analyzing: Small teams or individual analysts who need quick, ad hoc analysis and value SQL transparency alongside natural language access.
Anomaly AI is an AI-first analytics tool that lets users ask questions in plain English and receive charts, tables, and the underlying SQL query for transparency. It connects to common data sources including GA4, BigQuery, Snowflake, MySQL, Google Sheets, and Excel or CSV files.
Key features and functions:
- Natural language question interface with auto-generated charts
- SQL transparency so analysts can verify and modify queries
- Connects to GA4, BigQuery, Snowflake, MySQL, Google Sheets, and Excel/CSV
- Free tier available with no time limit
Anomaly AI is built around analyst workflows, with less emphasis on SMB-native integrations like accounting or e-commerce platforms. Teams that rely on tools like QuickBooks or Shopify may need additional setup to connect their data.
Pricing: Free plan at $0. Pro at $25 per month. Team at $30 per seat per month.
How to choose the right Power BI alternative
Match the tool to how your team works
The right BI tool depends on your data setup and how your team asks questions. Two factors matter most.
First, consider where your data lives. File-based teams working from Excel exports, CSVs, and Google Sheets need a tool that accepts those formats directly. Teams with data in a cloud warehouse (Snowflake, BigQuery, Redshift) can choose tools built for live warehouse queries like Sigma Computing.
Second, think about how your team uses analytics. One-off questions ("What were last month's top products?") call for a conversational, AI-powered tool. Recurring dashboards that update automatically call for a traditional BI platform with scheduled data refreshes. Some teams need both, and that is fine. Pick the tool that handles your most frequent use case well.
When to stay with Power BI
Power BI remains a strong fit for large, Microsoft-native enterprise teams. Organizations already invested in Azure, SharePoint, and Teams get tight integration across the stack. Teams with dedicated analysts who build and maintain dashboards will find Power BI's depth rewarding. The economics also improve when your company already pays for Microsoft 365 E5, which includes Power BI capabilities.
Frequently asked questions
Can I use Power BI for free?
Yes. Power BI Desktop is a free download that lets you build reports on your local machine. The limitation is sharing. Distributing dashboards to colleagues requires a Power BI Pro license at $14 per user per month, or a Premium Per User license at $24 per user per month. Free Desktop works well for individual analysis, but collaboration and scheduled refreshes sit behind the paid tiers.
What is the easiest BI tool for beginners?
It depends on what "easy" means for your team. AnalysisGPT lets you ask questions in plain English and get answers from uploaded files, which removes the dashboard-building step entirely. Looker Studio is a good fit for teams already using Google Analytics or Google Sheets, since the data connection is automatic. Metabase offers an open-source option with a visual query builder that requires no SQL knowledge.
Do I need SQL to use analytics software?
No. Many modern analytics tools offer no-code interfaces, visual query builders, or natural language input. Tools like AnalysisGPT, ThoughtSpot, and Domo let users type questions in plain English. Metabase and Sigma Computing provide visual interfaces that generate queries behind the scenes. SQL knowledge is still useful for advanced analysis, but it is no longer a prerequisite for getting answers from your data.
Can AI tools replace traditional BI?
AI-powered analytics tools are strong for ad hoc questions and exploratory analysis. Ask a question, get a chart, move on. Traditional BI platforms still serve a different purpose: governed, repeatable reporting with scheduled refreshes, role-based access, and audit trails. Most teams benefit from both. Use AI tools for fast answers and traditional BI for the dashboards your team checks every Monday morning.
What is the cheapest Power BI alternative?
Several options cost nothing to start. Looker Studio is completely free with no user limits. Metabase Community Edition is free when self-hosted. Anomaly AI offers a free tier with no time limit. AnalysisGPT offers a free Trial plan. Among paid plans, pricing varies widely depending on the number of users, data sources, and features you need.
How do I migrate from Power BI?
Start small. Pick one report or dashboard that your team uses frequently, and rebuild it in the new tool. Export the underlying data from Power BI as a CSV or connect the new tool directly to the same data source. Test the results with the people who actually use that report. Once one use case works well, expand to the next. Full migrations are rarely necessary. Many teams run two tools in parallel during the transition.
The simplest path from data to answers
The right Power BI alternative for a non-technical team removes the technical barrier entirely. No data modeling, no dashboard building, no waiting for an analyst to free up.
AnalysisGPT is built for this exact use case. Upload an Excel file, connect Google Sheets, or link a database. Then ask your question in plain English. You get charts, tables, and written summaries in seconds, not days.
Pricing starts with a free trial, then moves to paid plans based on which data sources your team needs.
Try AnalysisGPT free. Upload an Excel file and ask your first question in minutes.