You open Shopify on Monday morning and sales are up 12% from last month. Good news. Then you check Google Ads, and the ROAS (return on ad spend) column doesn't match what you expected based on those Shopify numbers. So you open QuickBooks, and cash is flat. Three tools, three stories, zero clarity. You're left asking the same question every operator asks: "What was our actual return on last month's ad spend?"
You're not alone. According to a 2025 survey by Ledge, a month-end close automation provider, reported by CFO.com, 50% of finance teams take six or more business days to close the books. The answer to your Monday morning question is sitting in your data. The problem is that your data is sitting in three different tools that don't talk to each other.
What a single view is
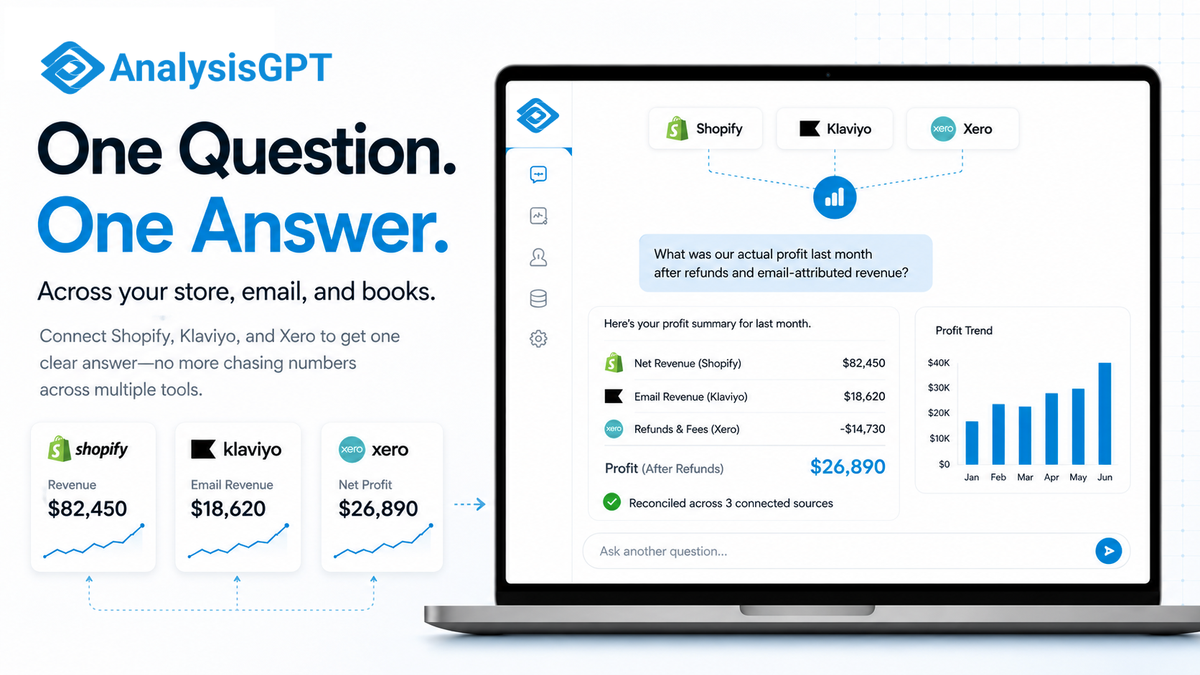
A single view is what happens when the numbers from your store, your ad platforms, and your accounting books feed into the same answer. Instead of opening three tabs and trying to reconcile three reports, you ask one question and get one number.
The concept goes by other names. Enterprise teams call it a single source of truth, a unified view, or a 360-degree view. The idea is the same regardless of the label: one place where your data agrees with itself.
For most SMBs, a single view does not require a data warehouse, a dedicated analytics team, or a six-month implementation project. The three data sources that matter most for a typical small business are the store (Shopify, WooCommerce, or a POS system), the ad platforms (Google Ads, Meta Ads), and the accounting books (QuickBooks, Xero). When those three agree on the same number, the operator can act on it instead of spending the morning reconciling it.
Key takeaways
- A single view connects your store, ad, and accounting data so one question returns one answer instead of three, with no more cross-referencing Shopify, Google Ads, and QuickBooks in separate browser tabs.
- Most SMBs already have the data they need. The problem is that it lives in tools that don't talk to each other, so the numbers never reconcile on their own.
- You don't need a data warehouse or a data team to get a single view working. Integration platforms and connected analytics tools have made it accessible for businesses with five employees or 500.
How a single view works without the jargon
A single view works by reconciling the different numbers each tool reports, so one question returns one consistent answer. Take a common scenario: you spent $2,000 on Google Ads last month and Shopify shows $8,000 in sales. That looks like a 4x return on ad spend.
Not so fast. QuickBooks shows only $6,200 in net revenue after payment processing fees, refund adjustments, and platform charges. Your actual return is 3.1x. Still healthy, but the gap between what Shopify reports and what QuickBooks reports changes the story.
The mismatch isn't a bug. Shopify reports gross revenue. Google Ads reports spend and conversions on its own timeline. QuickBooks reports net revenue after fees and deductions. Same month, three different numbers, all technically correct, all telling a different story.
Now multiply the complexity. The average Shopify store uses roughly six apps, according to a 2026 analysis of Shopify App Store data by Chargeflow, each generating its own data. Each app has its own reporting view. None of them were built to reconcile with each other.
A single view solves the multiplication problem by connecting these sources automatically. The store data, the ad data, and the accounting data flow into the same answer. When you ask, "What was my actual ROAS last month?" you get one number, not three conflicting ones.
One piece of practitioner advice captures the principle well. As one commenter on r/ecommerce advised, the first step is to "pick a single source of truth ... and force every number to reconcile there first." A single view is the structure that makes that reconciliation happen without a spreadsheet and a free afternoon.
What a single view really looks like
A single view looks different depending on the role asking the question, but in each case it replaces a manual reconciliation step with a direct answer.
The ecommerce founder asking, "Which products are profitable after ad spend?" Shopify shows revenue per product. Google Ads shows cost per campaign. But no single report connects the ad cost of acquiring a customer for Product A with Product A's actual margin after fees and returns. A single view pulls these numbers together so profitability shows up by product, not just by revenue line.
The operations lead asking, "Why does Shopify say we sold $50,000 but QuickBooks shows $42,000?" The $8,000 gap lives in payment processing fees, refund adjustments, shipping costs billed back, and timing differences between when Shopify records a sale and when the payment actually clears. Reconciling that gap manually across two systems is where time disappears. According to the same 2025 Ledge survey reported by CFO.com, finance teams spend 20 to 50 hours per month on reconciliation across three to five systems. Ledge sells month-end close automation, so the survey's framing reflects that commercial interest. The time cost, however, aligns with what operators describe independently on Reddit and accounting forums.
The marketing manager asking, "Which campaign actually drove revenue, not just clicks?" Google Ads tells you which campaign got clicks. Shopify tells you which products sold. Without a connection between the two, attribution is guesswork. A single view ties the ad spend to the revenue it produced so you can see which campaign moved the numbers and which just moved the click counter.
The finance lead asking, "Are our books closed, or are we still guessing at refund adjustments?" Some finance teams spend more time trying to explain the mismatches than actually fixing them. A 2025 case study published by Scrubbed, an outsourced accounting firm, described an ecommerce company that hadn't reconciled its books in months. The team was pulling cash figures directly from the bank and bypassing accounting entirely. A single view doesn't eliminate the need for a finance review, but it does eliminate the manual reconciliation work that makes the review take days instead of hours.
Where a single view works well and where it doesn't
A single view pays for itself in certain conditions and adds unnecessary complexity in others.
A single view works well when:
- Your team asks the same cross-system questions repeatedly. "What's our actual margin?" "Which campaign drove revenue?" If the question requires data from more than one tool, a single view saves the reconciliation time.
- You have a small team wearing multiple hats. When one person handles marketing and finance, they shouldn't need to manually reconcile two systems every week.
- Your business runs on three or more data-generating tools. Shopify, Google Ads, QuickBooks, a POS system, an email platform. The more tools, the more a single view pays for itself.
- Decisions stall because no one trusts the numbers. When your Monday meeting spends 30 minutes debating whose report is right, the root cause is structural: the data lives in tools that use different reporting definitions.
A single view doesn't work well when:
- The underlying data is inaccurate. A single view connects data sources, but it can't fix bad inputs. If your Shopify product categories are wrong or your QuickBooks chart of accounts (your category structure for revenue and expenses) is a mess, connecting them just surfaces the mess faster.
- You need real-time dashboards for high-frequency operations. A single view is built for business questions, not for monitoring warehouse pick rates every 30 seconds. Real-time operational dashboards are a different tool for a different job.
- Your business only has one data source. If everything runs through one system and you don't need cross-system answers, a single view adds complexity without adding clarity.
A well-known 2008 study by Raymond Panko at the University of Hawaii found that 94% of spreadsheets contain errors. The study is nearly two decades old, but the underlying finding about manual data handling remains widely cited. A single view reduces the manual data handling that creates those errors, but only when the source data is reasonably clean.
How to evaluate if a single view is right for your business
A single view is worth pursuing when your team regularly loses time reconciling data across tools rather than acting on it. Four diagnostic questions can help you decide.
Do you open three or more tools to answer a single business question? If yes, a single view eliminates the toggling between Shopify, Google Ads, and QuickBooks. If no, your current setup is likely sufficient.
Do team members quote different numbers for the same metric? If yes, the problem is usually that each team is pulling from a different source with different definitions. A single view gives everyone the same number. If no, your reporting is already aligned and a single view adds less value.
Does month-end reconciliation take more than a few hours? If yes, a single view automates the cross-referencing that's eating the time. If no, your reconciliation process is already manageable without additional tooling.
Have you ever deferred a decision because you couldn't trust the data? If yes, delayed decisions have a real cost, and a single view replaces the re-pulling with a reliable answer. If no, your data confidence is already strong enough to act on.
If you answered yes to two or more of these questions, the problem is likely structural, not a skills gap or a tool gap.
FAQ
What is a single view in ecommerce?
A single view connects your store, advertising, and accounting data so you can ask one question and get one answer. Instead of reconciling Shopify, Google Ads, and QuickBooks separately, a single view pulls the relevant numbers from each source into a shared answer.
Do I need a data warehouse to build a single view?
No. Data warehouses are one way to build a single view, but they require technical setup and maintenance. SMBs can achieve a single view with integration platforms or connected analytics tools without warehouse setup or a data team.
Why do my Shopify sales not match my QuickBooks revenue?
Shopify reports gross revenue before fees, returns, and payment processing charges. QuickBooks reports net revenue after those deductions. The gap is expected. A single view reconciles both so you can see gross and net in the same place.
Tools that help you build a single view
The right tool for a single view depends on how many data sources you have and how much manual work you can tolerate. Three categories cover the range.
Spreadsheet consolidation with Google Sheets or Excel. The lowest-cost option. You export data from Shopify, Google Ads, and QuickBooks into a shared spreadsheet and build formulas to reconcile the numbers. The approach is free and familiar. The downside is that it breaks when volume grows. Manual exports go stale the moment you download them. Formulas get fragile as the spreadsheet gets more complex. For a business with one or two data sources and low volume, spreadsheet consolidation works. For anything beyond that, the maintenance cost outpaces the value.
Integration platforms like Zapier, Make, or Coupler.io. These tools automate the data flow between your systems. Coupler.io, for example, can pull Shopify data into Google Sheets on a schedule. Zapier and Make can trigger data syncs based on events. The cost is moderate, generally in the range of $20 to $100 per month at the time of writing, depending on volume and complexity. The limitation is that integration platforms move data but don't analyze it. You still need a dashboard or a spreadsheet on the other end to make sense of what arrives. Integration platforms are a strong fit when you want fresh data in one place but are comfortable building your own reports.
Connected analytics tools like Databox, Klipfolio, or AnalysisGPT. Connected analytics tools plug directly into your data sources and let you ask questions or build dashboards without exporting anything. Databox specializes in pre-built dashboards for marketing and sales metrics. Klipfolio focuses on custom dashboard building for teams that want visual reporting. AnalysisGPT connects to databases, spreadsheets, and business tools and lets you ask questions in plain language. Connected analytics tools are a strong fit when you want answers from your data without building reports manually. The cost is higher than spreadsheets or integration platforms, but for businesses with three or more data sources, the time saved on manual reconciliation can offset the subscription cost.