It’s Monday morning, and since your small ecommerce business doesn’t have a data team, you’re pulling spreadsheet numbers from Shopify, Amazon, and GA4 to prepare for your weekly performance meeting. Shopify says revenue is up. Amazon shows a different sales total. GA4 tells another story about where the orders came from.
You have 15 minutes before the meeting, and you’re still reconciling numbers instead of thinking about how to actually grow the business.
For many ecommerce brands, this is what reporting without a data team looks like. Sales, traffic, and order data exist across separate applications, but your team has to assemble the numbers by hand before you can begin to understand how the business is actually performing.
In this guide, you’ll find out why ecommerce reporting without a data team becomes harder as your business grows, what it's costing you, and practical ways to fix it.
Key Takeaways
- Disconnected business data and reporting delays happen naturally as you add new software platforms, not because your team lacks organization.
- Relying on manual spreadsheets to connect these separate systems costs your business time, data accuracy, and decision speed.
- Brands can close the reporting gap and get clear, unified answers without adding a data analyst or building complex dashboards.
What ecommerce reporting looks like without a data team
Without a data team, ecommerce reporting becomes a fragmented, manual process that quickly outgrows the way you track performance. Over time, this manual setup takes a heavy toll in four distinct ways: conflicting metrics between platforms, hours spent on manual report building, messy version-control chaos, and slower decision-making.
1. Conflicting numbers make performance data hard to trust
Shopify, Amazon, GA4, ad platforms, and email tools each measure performance in their own way. One system may count an order when it’s placed, while another focuses on payment, fulfillment, clicks, sessions, or campaign attribution.
The result of scattered performance data is a reporting process in which team members have to reconcile which numbers disagree, and why, before they can explain to the rest of the team what the data means.
2. Hours are wasted on manual report building
Without a data team, tracking performance often becomes a tedious manual reporting ritual that burns through hours of valuable time. The process is often the same: someone exports CSVs from Shopify and Amazon, cleans up the formatting, pastes numbers into a spreadsheet, fixes broken formulas, and updates the charts.
These workarounds may start as practical fixes, but over time, they build a system that is not only unreliable but a massive drain on your weekly productivity.
3. Spreadsheets create competing versions of the truth
Moving back and forth from one spreadsheet to another eventually leads to conflicting versions of the truth, leaving you to wonder which data you should trust because human error and misinterpretation are nearly impossible to avoid when the bulk of your reporting relies on human copy-and-paste processes.
When different teams work from different reports, they may also walk into meetings with conflicting impressions about what’s happening in the business. This is a structural problem, not a personnel issue.
4. Decision-making slows down
Waiting on team members to pull up and organize data, or having to do it yourself, creates a decision lag that keeps your ecommerce business from moving quickly.
When you have to resolve conflicting data before you can consider what to fix, pause, repeat, or scale in your business, it hampers your ability to make quick, efficient decisions.
How a reporting gap forms
As ecommerce businesses expand their software stacks to solve basic operational needs, a reporting gap forms that prevents you from getting a clear picture of what’s happening across all aspects of the company, including:
- Sales across multiple channels
- Website behavior
- Paid ad returns
- Social media insights
- Inventory and fulfillment information
Without a central data strategy to connect all your reporting sources, sales, traffic, inventory, and fulfillment data stay isolated across different platforms. This leaves you with disconnected views of the numbers, with each only showing a part of what’s happening.
What reporting gaps costs you
Reporting gaps consume your profits through lost hours, invisible errors, and delayed decisions.
1. The cost of lost hours
When your team has to spend their week manually copying and pasting numbers, the real expense is the hidden tax of lost hours and missed opportunities.
For an SMB ecommerce brand, even a few hours of manual reporting each week represent significant losses when strategic work gets pushed aside and replaced with repetitive admin work. You’ll recognize this problem when your team spends hours exporting CSVs, formatting mismatched columns, and manually recalculating metrics instead of focusing on growth drivers like optimizing ad spend, negotiating with suppliers, improving conversion rates, or planning inventory.
2. The cost of invisible errors
Invisible spreadsheet errors cost your business profit and momentum by distorting numbers you rely on, such as margins, ROAS, inventory planning, and channel performance.
87% of operations leaders say poor data quality has hampered progress on digital initiatives, while only 30% report significant improvement in data quality and reliability over the past two to three years, according to PwC's 2026 Digital Trends in Operations Survey.
Mistakes happen naturally when you try to force data from multiple software platforms into a single report because every system counts metrics differently, uses different time zones, and exports data in its own format.
When your team has to manually reconcile mismatched software exports, it’s very easy for human errors to slip in and cause you to make major financial decisions based on flawed data.
At enterprise scale, Gartner has estimated that poor data quality costs organizations an average of $12.9 million per year. That figure isn’t an SMB ecommerce benchmark, but it shows that data quality becomes expensive when teams rely on reports they can’t fully trust.
3. The cost of decision lag
Slow decision-making costs your business lost revenue and wasted ad spend because reporting delays from manual processes stall the actions that keep an ecommerce business profitable.
For example, if it takes three days to reconcile which ad sets are making money, or whether a specific SKU is running low, the window to act may already be closing. These kinds of delays keep your team reacting to old problems instead of making timely calls about what to pause, fix, repeat, or scale.
How to build ecommerce reporting without a data team
Ecommerce teams can manage data in one of three ways: manual reporting, business intelligence (BI) software, or specialized software built for SMBs.
Tier 1: Improve your manual reporting process
If your business is still relatively small, you can start by making your existing process more consistent. Standardize your metric definitions, reduce duplicate spreadsheets, document how reports are built, and schedule reporting on a regular cadence.
This approach costs very little, however, someone still has to gather data, reconcile numbers, and maintain the reporting process as the business grows. So while it can help offset the cost of errors and decision lag, the manual process will still cost your team hours of time and likely result in some reporting gaps.
Tier 2: Connect your reporting tools with BI
As reporting becomes more complex, many businesses adopt BI platforms or ecommerce reporting systems that combine data from multiple sources into shared dashboards.
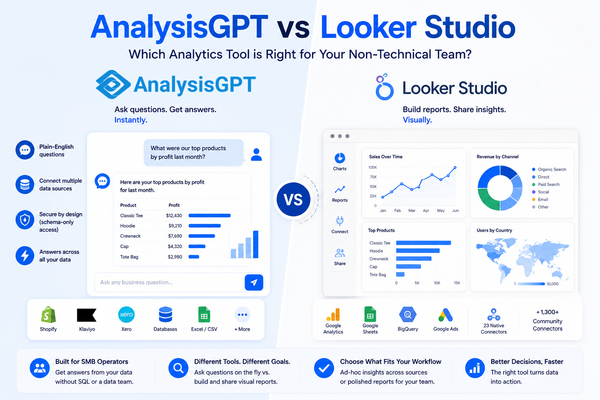
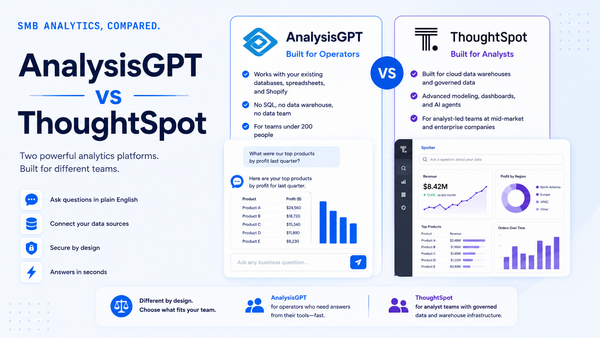
These platforms can reduce manual reporting, but they’re often designed for larger organizations with dedicated analysts or data teams. Building dashboards, maintaining data connections, and answering new business questions usually requires technical expertise that many SMB ecommerce teams don’t have.
Tier 3: Use AnalysisGPT for purpose-built conversational analytics
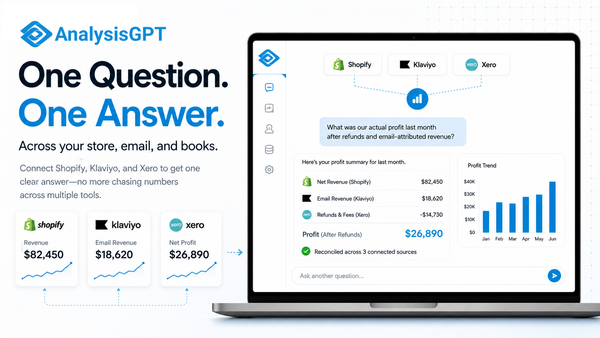
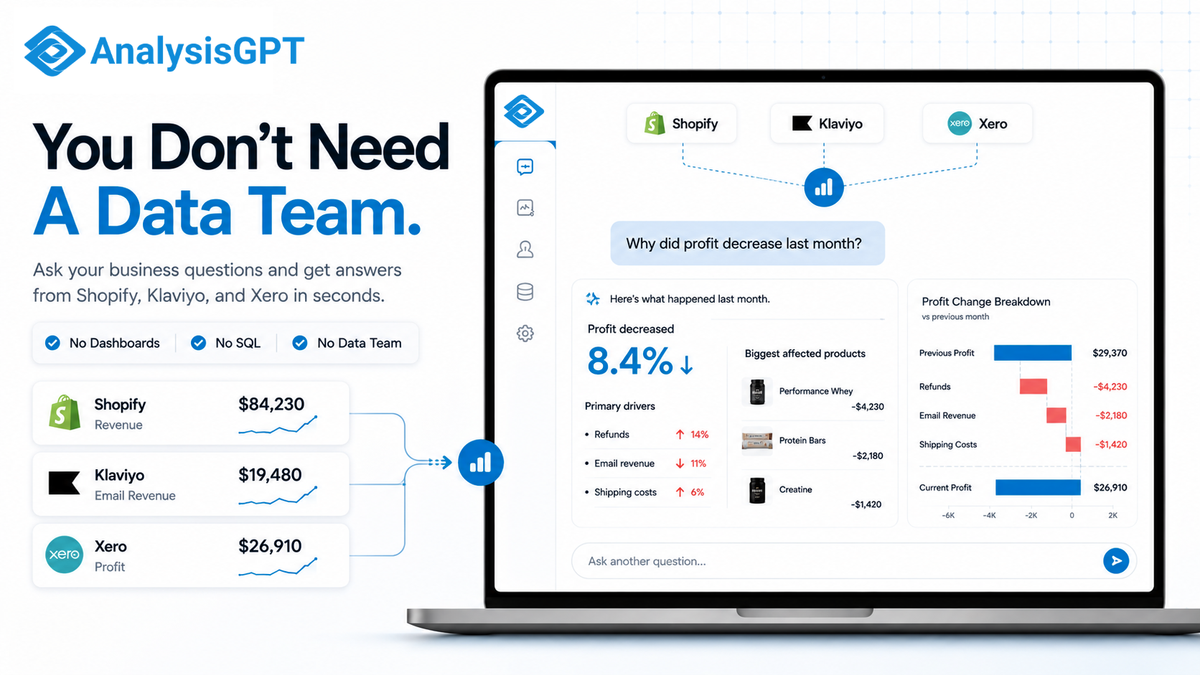
AnalysisGPT is a BI software designed for small businesses that need answers without building dashboards or hiring a data team. It connects to the business tools you already use, such as Shopify and Klaviyo, and also lets you connect your databases.
AnalysisGPT’s dashboard is a simple chat window that lets you ask questions in plain language to get answers about performance data from multiple systems.
Imagine you're walking into your Monday leadership meeting. Instead of opening Shopify, Klaviyo, GA4, and your ad platform one by one, you open AnalysisGPT and ask it questions like:
- What was our total revenue last week?
- Which products generated the most sales?
- How did our email campaigns perform?
- Which marketing channel drove the most orders this month?
- How does this week's website traffic compare with last week?
The program pulls relevant data from each of your connected systems to form answers to your questions, so you can spend the meeting discussing what happened instead of explaining why the numbers don't match.
AnalysisGPT is the best solution for small and medium-sized businesses
that don’t have ecommerce reporting teams on staff. When you’ve outgrown manual spreadsheets and traditional dashboard software feels too expensive, too technical, or too time-consuming to maintain, it’s time to consider AnalysisGPT.
What to look for in a reporting solution
The right ecommerce reporting solution should reduce reconciliation work instead of giving you another dashboard to maintain, and without requiring you to hire a data team or technical expert.
As you compare reporting tools, focus less on the number of charts or integrations and more on whether the software helps your team answer business questions quickly and confidently.
Look for a solution that can:
- Connect to the business systems you rely on most
- Use consistent metric definitions across those systems
- Minimize setup and ongoing maintenance
- Let non-technical team members find answers without building reports or writing queries
- Show where the data came from so you can verify the results
The best reporting solution is the one your team will actually use. If getting data-related answers still requires exporting spreadsheets, updating dashboards, or waiting on help from a specialist, your reporting process is probably more complicated than it needs to be.
Every growing ecommerce business reaches a point where reporting should support decisions instead of delaying them. If your team is spending more time preparing reports than using them, try AnalysisGPT free for 30 days and see what one unified view of your data can look like.