Your operations lead needs last month's return rate by product category before a vendor call in an hour. She opens Shopify, clicks Export, waits for the CSV, opens it in Google Sheets, spends 20 minutes cleaning column headers, builds a pivot table, and then realizes the export does not include refund reasons. She re-exports. By the time she has a number she trusts, 45 minutes have passed for a question that should take 45 seconds. If this sounds familiar, you are not alone. Shopify Community threads are full of merchants asking the same thing: why is it so hard to get answers from my own data?
Why getting answers from Shopify is harder than it should be
Shopify's default data-access model is CSV-first. Products, orders, customers: the exit door for all of them is a downloaded file. But a CSV is a snapshot, not an answer. It does not cross-reference data from different reports, it does not update after you download it, and it does not tell you why something changed. Analytics history, customer journey data, abandoned cart sequences, and attribution data are not included in any Shopify CSV export.
The result is a repeating cycle: export, wrangle, discover gaps, re-export. One Shopify Community merchant put it bluntly: "I don't need a separate app that I have to pay a monthly service for. I just need my raw data." Small business owners already lose an average of 96 minutes of productivity daily to tasks like searching for information across tools (Salesforce/Slack, 2024). CSV wrangling compounds the problem: the answer exists in your store, and you are spending your time extracting it instead of reading it.
Key takeaways
- You do not need to export a CSV every time you have a question. Shopify's built-in analytics, connected BI tools, and natural language analytics tools each solve different layers of the problem.
- The right approach depends on what you are asking. Simple traffic questions have a different answer path than cross-source inventory analysis.
- Start with what Shopify already gives you, then connect outward only when you hit a wall. The goal is fewer exports, not zero exports.
Step 1: Know what Shopify already answers without a CSV
Shopify's built-in Analytics dashboard shows total sales, top products, and sessions by traffic source without any export. Every Shopify plan includes it. Before you reach for a CSV, check whether the answer already exists in Analytics under Reports.
The verification cue is simple: if you can see the answer on screen, you do not need a file. The catch is plan-tier gating. Shopify Basic gives you a limited set of pre-built reports. Advanced and Shopify Plus unlock custom reports and more granular filters. If you are on a lower-tier plan, you will hit this ceiling quickly when your questions get more specific.
Where to start: open your Shopify admin, click Analytics, then Reports. Browse the categories (Sales, Customers, Acquisition). If your question maps to an existing report, stop here.
Step 2: Use Shopify's built-in report filters before exporting
Many merchants skip the filter and date-range options in Shopify's report builder and jump straight to CSV. Before you export, try narrowing the report first.
Apply a date range. Add a comparison period. Filter by product type, sales channel, or customer tag. Use the column selector to remove noise. Shopify's report builder can be more flexible than you might expect.
Verification cue: can you screenshot the answer? If yes, you do not need a CSV. If the report builder cannot slice the data the way you need (cross-referencing two report types, for example), move to Step 3.
Step 3: Use ShopifyQL for custom queries
ShopifyQL is Shopify's query language for commerce data. It uses syntax similar to SQL (a database query language) scoped to Shopify's data model. You write a query with FROM, SHOW, WHERE, and GROUP BY clauses, and Shopify returns the results.
ShopifyQL is a documented, first-party capability. Shopify has offered a merchant-facing interface called ShopifyQL Notebooks on some plans, though its current availability is not confirmed in Shopify's own documentation. If your plan includes it, Notebooks let you write and save queries directly inside Shopify's admin. If not, ShopifyQL is still accessible through the GraphQL Admin API for teams with developer resources.
The trade-off: ShopifyQL requires familiarity with query syntax. If nobody on your team writes queries, this step may not be practical. But if you have someone comfortable with basic SQL, ShopifyQL can answer questions that the standard report builder cannot, without ever leaving Shopify.
Step 4: Connect a BI tool to Shopify's API
For recurring questions that Shopify's reports cannot answer, connecting a business intelligence (BI) tool is the next step up. Tools like Power BI or Looker Studio (Google's BI tool) offer Shopify connectors or integrate through third-party data pipelines.
The advantage over CSV: the data stays live. A connected BI dashboard updates automatically, so you are not working from a stale snapshot. You can also combine Shopify data with other sources (Google Analytics, ad platforms, accounting tools) in a single view.
The trade-off: setup takes time. Most BI tools require some configuration, and many still expect you to know SQL, DAX (a formula language used in Power BI), or a formula language to build the reports you want. If you do not have someone on your team who can set up and maintain a BI dashboard, this step adds overhead without reducing it.
Step 5: Ask your data in plain language
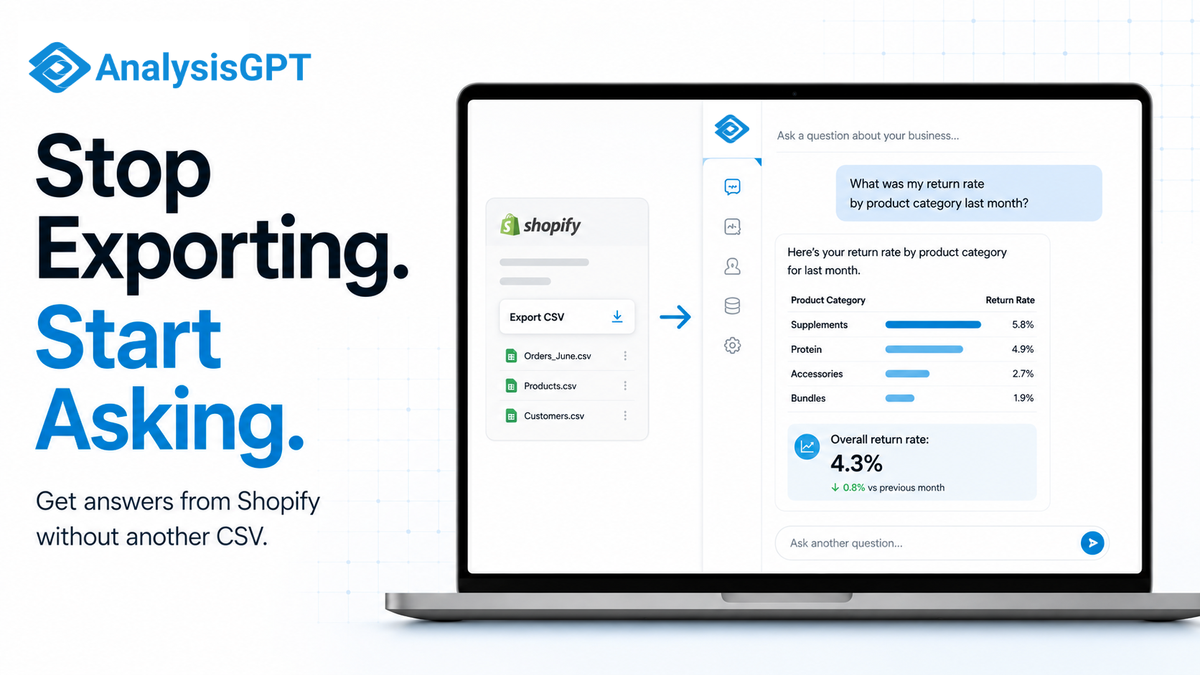
Natural language analytics tools let you type a question ("What was my return rate by product category last month?") and get an answer without writing SQL or cleaning a CSV. You either upload a Shopify export once or connect through an API, and the tool handles the querying from there.
Tools in this category include Luca AI, which is purpose-built for Shopify analytics, and AnalysisGPT, which connects to multiple data sources including Shopify. Both let non-technical users ask questions in plain English and get charts or tables back.
Verification cue: can you type the question and get a chart? If the tool returns a clear answer without you needing to write a formula or build a pivot table, you have moved past the CSV cycle.
The trade-off: you are adding a tool. Evaluate pricing, data security, and whether the tool connects to everything you need, not just Shopify.
Step 6: When a CSV is still the right call
CSVs are not always wrong. There are situations where exporting a file is the most practical option:
- One-time bulk operations: migrating products to a new platform, running a bulk price update, or restructuring your catalog.
- Sharing data with external partners: handing your accountant a clean order history or sending a vendor a product list.
- Archiving a point-in-time snapshot: keeping a record of your catalog or customer list as of a specific date.
The point is not to eliminate CSVs entirely. The point is to stop using them as your default path to every answer. Export deliberately, not reflexively.
Common pitfalls when moving beyond CSV exports
Most of the friction after switching away from CSV exports comes from habits, not tool limitations. These four patterns account for most backsliding.
Connecting a tool but still exporting out of habit. You set up a BI dashboard or a natural language analytics tool, and then you keep exporting CSVs because it is what you know. The new tool only saves time if you actually use it. Give yourself two weeks of asking questions through the new tool before deciding whether it works.
Choosing a BI tool that requires SQL when nobody writes SQL. Power BI and Looker Studio are powerful, but they assume a level of technical comfort that many small teams do not have. If your team is not going to learn DAX or write queries, pick a tool that does not require it.
Ignoring Shopify plan-tier limits. Advanced analytics features are not available on every Shopify plan. Before you spend time trying to build custom reports in Shopify's admin, check whether your plan supports them. If not, you may need to jump to Step 4 or Step 5 sooner.
Trusting a stale CSV when real-time data matters. A CSV is frozen the moment you download it. If you are making inventory decisions or running a time-sensitive promotion, the numbers in that file may already be wrong by the time you finish cleaning them. One Reddit thread described how Shopify CSV field names and formats change between exports, breaking automated pipelines that depend on consistent column headers. Another thread with 29+ comments asked why Shopify exports data "so horrifically."
What to do if you do not have a data team
Tier 1: Maximize Shopify's built-in analytics (free, lowest effort). Start by learning what the report builder already does. Save filtered views for the questions you ask most often — top products by revenue this month, returning customer rate, sessions by traffic source. Set comparison periods (this month vs. last month, this quarter vs. same quarter last year) so you can spot trends without exporting anything. Bookmark the reports you check weekly. If you find yourself exporting a CSV to answer a question, check the report builder first: you may be one filter away from the answer. Cost: $0 beyond your existing Shopify plan. Limit: you will hit the plan-tier ceiling on what reports you can customize, and you cannot cross-reference data across sources (Shopify data stays inside Shopify). For many merchants, this tier covers 60-70% of routine questions.
Tier 2: Add a Shopify analytics app or a Google Sheets connector (structured, mid-cost). Apps in the Shopify App Store can extend your reporting with pre-built dashboards that go beyond what Shopify's native reports offer — margin tracking, cohort analysis, inventory forecasting. Google Sheets connectors (through tools like Coupler.io or Supermetrics) pull Shopify data into spreadsheets on a schedule, so you are at least working with fresher data than a manual CSV export. Set the sync frequency to match your decision cadence: daily for fast-moving stores, weekly for most. The setup takes 30-60 minutes, and the result is a spreadsheet that updates itself. Cost: $10 to $50 per month. Limit: you are still spreadsheet-adjacent. The data is more current, but the analysis still depends on your ability to build formulas and pivot tables. If your team does not know VLOOKUP or pivot tables, the connector delivers data you cannot use.
Tier 3: Use a natural language analytics tool (purpose-built, connected). Tools like Luca AI and AnalysisGPT let you connect to Shopify (or upload a CSV once) and ask questions in plain English. Instead of building a pivot table, you type "What was my return rate by product category last month?" and get a chart back. No SQL, no pivot tables, no dashboard building. Before committing, evaluate three things: data security (where does your data go, and who can access it), integration depth (does the tool connect to everything you need, not just Shopify), and trial access (can you test it with real data before paying). Cost: varies by tool and plan. Limit: you are adding a subscription and trusting a third-party tool with your data, so the evaluation step matters.
Frequently asked questions
These are the questions merchants ask most often after hitting the limits of Shopify's built-in CSV exports.
Can I query my Shopify data without knowing SQL?
Yes. Shopify's built-in report builder does not require SQL. For more advanced questions, natural language analytics tools like Luca AI and AnalysisGPT let you type questions in plain English and get answers back. ShopifyQL does use query syntax, but the built-in reports and natural language tools do not.
What data can I not get from a Shopify CSV export?
Shopify CSV exports cover products, customers, and orders. They do not include analytics history, customer journey data, abandoned cart sequences, or attribution data. The Shopify Data Exporter app also limits exports to data from January 1, 2019, onward. If you need any of those data types, you will need to use the Analytics dashboard, a connected BI tool, or a third-party analytics app.
Do I need Shopify Plus to get better analytics?
Not necessarily. All Shopify plans include the Analytics dashboard with basic reports. Higher-tier plans unlock custom reports and more filters. ShopifyQL, Shopify's query language, is a documented first-party capability. Shopify has offered a merchant-facing interface called ShopifyQL Notebooks on some plans, though its current availability is not confirmed in Shopify's own documentation. For analytics beyond what your plan offers, connecting a BI tool (Step 4) or a natural language analytics tool (Step 5) works on any Shopify plan.
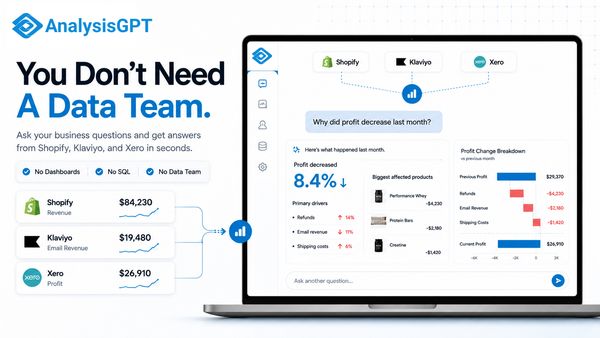
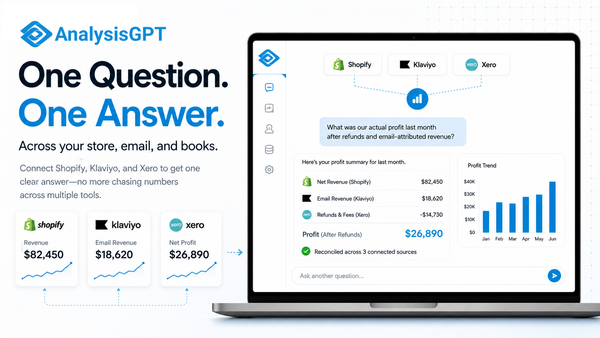
AnalysisGPT is a dedicated analytics tool for non-technical operators. It connects to the data sources you already use and lets you ask business questions in plain language. See how it works at analysisgpt.ai.