You have a business question. You want to know why revenue dropped last quarter, or which products have the best margin, or whether your last marketing campaign actually moved the needle. The answer is in your data. But your data is in QuickBooks, Shopify, Google Sheets, and maybe HubSpot - and pulling it all together into something readable means asking someone technical to help, waiting a few days, and getting back a CSV that still doesn't quite answer what you asked.
For most small businesses, that's just how it works. You don't have a data team. You have a business.
That experience is changing. A category of tools now lets any team member ask a business question in plain English and get a structured answer - a chart, a table, a number - without involving a developer, without writing code, and without waiting. This guide explains how those tools work and what using them actually looks like for a non-technical team.
Key takeaways
- Self-serve analytics removes the technical bottleneck. Any team member can answer business questions without SQL, a developer, or waiting days for a report.
- Natural language analytics changes how teams use data. Instead of requesting reports, users ask questions in plain English and receive charts, tables, or summaries in seconds.
- Small businesses benefit the most. Teams without dedicated analysts can make faster, more informed decisions by connecting existing data sources and exploring them directly.
Why getting data answers takes so long
Self-serve analytics for small business is the ability for any team member to get answers from their own data - without filing a request, waiting for a report, or knowing SQL (Structured Query Language, the programming language most databases use). For a growing company without a dedicated analyst, that ability is the difference between making decisions with data and making them on gut feel.
Most content written about self-serve analytics assumes your company already has a data team. The framing is always the same: analysts get overwhelmed by ad hoc requests, so self-serve tools let business users handle simple questions themselves. That framing is accurate for large companies. It's not accurate for the 50-person company where the founder IS the analyst, the ops lead is assembling reports manually, and questions go unanswered because data takes too long to get.
If you've recognized yourself in the signs you've outgrown spreadsheets, this is what comes after.
The old way and the new way
What self-serve analytics means for a team without a data analyst
Self-serve analytics is the ability for any team member to answer data questions without a technical intermediary. For enterprise teams, this means offloading report requests from an overloaded data team. For small businesses without one, self-serve analytics means having access to your own data at all - without a developer, without SQL, and without waiting for Monday's report.
The term comes from the enterprise world, which explains why most guides on the topic assume you have analysts on staff. But the core capability - ask a question, get an answer, without technical help - is at least as valuable, and probably more urgent, for the team that never had analysts in the first place.
Self-serve analytics tools range from traditional BI platforms - Business Intelligence (BI) means software that turns raw data into dashboards and reports - to a newer category called conversational analytics, where you interact with your data through natural language questions rather than pre-built dashboards. The conversational category is where the most significant change for non-technical teams is happening.
Three types of people who get blocked when data is hard to reach
Three roles consistently get blocked when business data is hard to reach without technical help. The ops lead assembles reports manually from three tools every week. The founder makes gut-feel decisions because answering a data question takes half a day. The marketing manager can't see campaign ROI without asking for technical help. Each of them faces the same underlying problem - data that exists but can't be reached without friction.
Here is what that looks like in practice:
- The ops lead exports from QuickBooks, then from Shopify, then opens a spreadsheet, pastes everything in, runs a VLOOKUP, and builds a chart. By Thursday, it's ready. The questions that came up in Tuesday's meeting get answered at next week's meeting.
- The founder wants to know which products are underperforming this quarter. The answer is in the data. But getting it means either doing the export-and-spreadsheet process themselves, or asking the ops lead who is already handling that for everything else. The decision gets made on instinct instead.
- The marketing manager runs a campaign and wants to know whether it drove revenue - actual sales, not clicks. That question spans at least two tools - the marketing platform and the financial data. Without a way to connect them, the question stays unanswered.
The through-line is the same for all three: the data exists, but the process of getting to it is slow enough that decisions happen without it.
How natural language analytics works
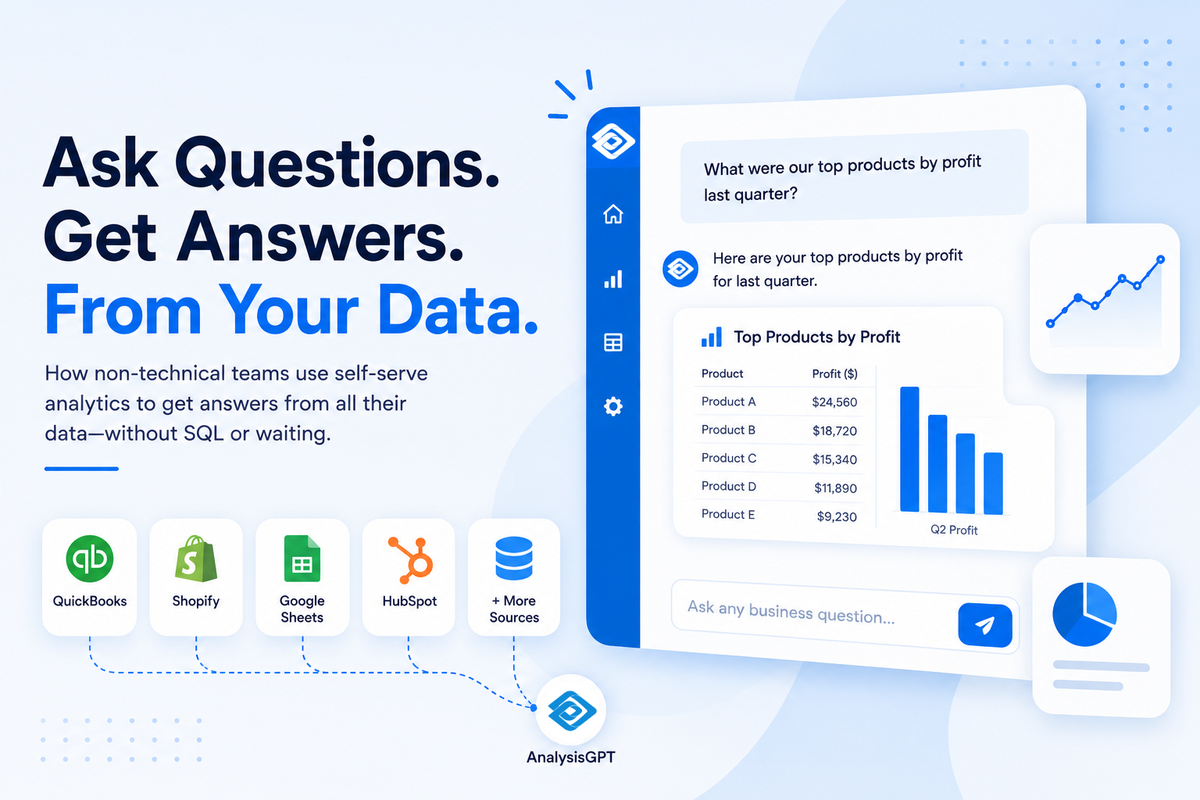
Natural language analytics lets any user ask a business question in plain English and receive a structured answer - a chart, table, or summary - without writing SQL or building a dashboard. The system uses NLP (Natural Language Processing, the technology that lets software interpret questions written in plain language) to interpret the question, translate it into a database query, and return results in seconds.
The process looks like this:
- You type a question: "What were my top five products by revenue last month?"
- The tool parses the question - it identifies the metric you want (revenue), the dimension you want to cut it by (product), the time filter (last month), and the ranking you need (top five)
- The tool generates a database query and runs it with read-only access to your connected data
- The result comes back as a chart or table - the direct answer to what you asked
The key phrase is "behind the scenes." You don't see the SQL. You don't write it. If the first answer isn't quite what you needed, you follow up in natural language: "Show me the same breakdown for the previous quarter." The tool handles the revision.
This is different from a pre-built dashboard, which answers the questions someone thought to ask when they built it. Natural language analytics answers the question you have right now.
Types of analytics tools non-technical teams actually use
Three broad categories of tools exist for non-technical teams that want data answers without involving a developer. They differ significantly in what they require to set up, how much technical skill they assume, and whether they can answer an ad hoc question in plain English or require a pre-built dashboard to get to any answer at all.
For a detailed look at current platforms, the best AI analytics tools for small business covers specific options.
Traditional BI tools can do powerful things, but they require significant technical investment. Tableau and Power BI were built for companies with data engineers who model and maintain the underlying data structure. A 40-person company without that resource gets the tool but not the capability.
Conversational analytics tools work the other way: the technical complexity is abstracted away. Connect your data sources, ask questions, get answers.
How to get started without a data team
To get started, connect your existing data sources and ask the business questions you've been putting off. Most conversational analytics tools take hours to set up, not weeks — no technical hire required. The process is designed for operators who need answers, not data engineers building infrastructure.
Here is the straightforward path:
- Connect your data sources. Authorize the tool to read your existing platforms - your accounting software, your ecommerce platform, your CRM. You're granting read-only access, not moving your data anywhere.
- Start with the questions you already have. Don't try to build a reporting system on day one. Begin with the business questions that currently go unanswered - the ones you'd normally have to ask someone technical.
- Iterate on what you learn. Natural language interfaces are conversational. If the first answer isn't quite right, ask a follow-up question. Refine from there.
- Share answers with your team. Most tools let you save queries, export charts, or share results. Build a lightweight habit around the questions that matter most for your business.
The test of a useful self-serve analytics tool isn't whether it handles complex analytical questions. It's whether a non-technical person can get to an answer in under five minutes, without asking for help.
What this looks like in practice
A concrete scenario shows what the before/after difference looks like in daily practice. Your ops lead needs to know why revenue dropped in Q3. Old way: export from Shopify, export from your CRM, reconcile in a spreadsheet, present on Thursday. New way: connect both sources once, type the question, get the breakdown in under a minute. Same question, four days faster.
The more significant change is what happens to the questions that never got asked before - the ones skipped because the effort wasn't worth it. If you can ask "which customers haven't reordered in 90 days?" and get an answer in seconds rather than days, you ask it more often. And you act on it.
That's the core shift: faster answers to the same questions, plus the ability to ask questions you'd previously written off as too slow to answer.
Where AnalysisGPT fits
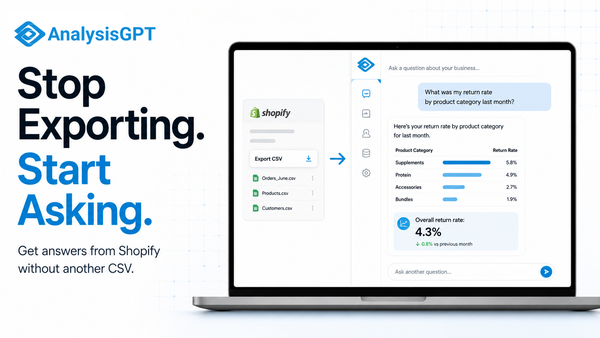
AnalysisGPT is a conversational analytics platform built for non-technical operators at small and medium-sized businesses. You connect your data sources - including Shopify and QuickBooks, both of which have live integrations - and ask business questions in plain English. The platform handles the query translation, runs against your data, and returns answers as charts and tables.
On data security: the LLM sees only column fields and table metadata, the LLM formats the query, read-only access executes the query, and user data stays in the customer's systems.
AnalysisGPT is free for 30 days. Connect a data source or upload a spreadsheet and see what your data looks like when you can ask it questions directly.