You open your laptop on Monday morning, and the first task is already manual: pull last week's sales from Shopify, match them against ad spend in a separate dashboard, then cross-reference inventory counts in a spreadsheet someone emailed Friday. By 9am you've touched four tools and built one messy tab that's already out of date. A 2012 McKinsey Global Institute report found that knowledge workers spend 9.3 hours per week searching for and gathering information. Some of that time shows up as copying numbers between tools that don't talk to each other.
The best tool for connecting multiple data sources depends on what you actually need: spreadsheet consolidation for a quick one-off merge, workflow automation to sync records between apps, ETL pipelines when volume and source count grow, or connected analytics when your team needs to ask recurring business questions across several tools without writing SQL.
Key takeaways
- Multiple sources, multiple failure points. Every manual copy-paste step between tools adds delay and error risk. The right tool category eliminates the step, not just the spreadsheet.
- Tool category matters more than tool name. A workflow automation tool and a database-backed dashboard solve fundamentally different problems. Match the category to your technical capacity and question frequency.
- Connected analytics fills a gap for non-technical teams. For SMBs without a data team, a tool that queries sources directly often fits better than building an export-and-clean workflow, though ETL or a warehouse is the right answer when volume and source count demand it.
Why connecting data from multiple sources is harder than it sounds
Connecting data from multiple sources fails because source systems use different schemas, exports go stale immediately, and manual handling compounds errors at every step.
Schema conflicts across tools. Shopify calls it "order date." QuickBooks calls it "transaction date." Your spreadsheet calls it "Date (mm/dd)." When you merge these manually, column headers don't match, date formats clash, and category labels overlap. Each mismatch requires a judgment call that compounds across hundreds of rows.
Stale snapshots replace live answers. An export is accurate at the moment you pull it. By the time you've cleaned and merged three exports, the underlying data has moved on. BetterCloud's 2025 State of SaaS report found that the average mid-size company uses over 100 SaaS applications (though BetterCloud, as a SaaS management vendor, has a commercial interest in this figure). Data is changing in dozens of places while your spreadsheet sits still.
Error rates climb with manual handling. A peer-reviewed study by Poon et al. (2024) found that 94% of published spreadsheets contained errors. That figure supports a general pattern: the more manual work between source and report, the more room for mistakes. Spreadsheets aren't the enemy, but using them as a data integration layer adds risk that grows with each source you add.
Best tools for connecting data from multiple sources
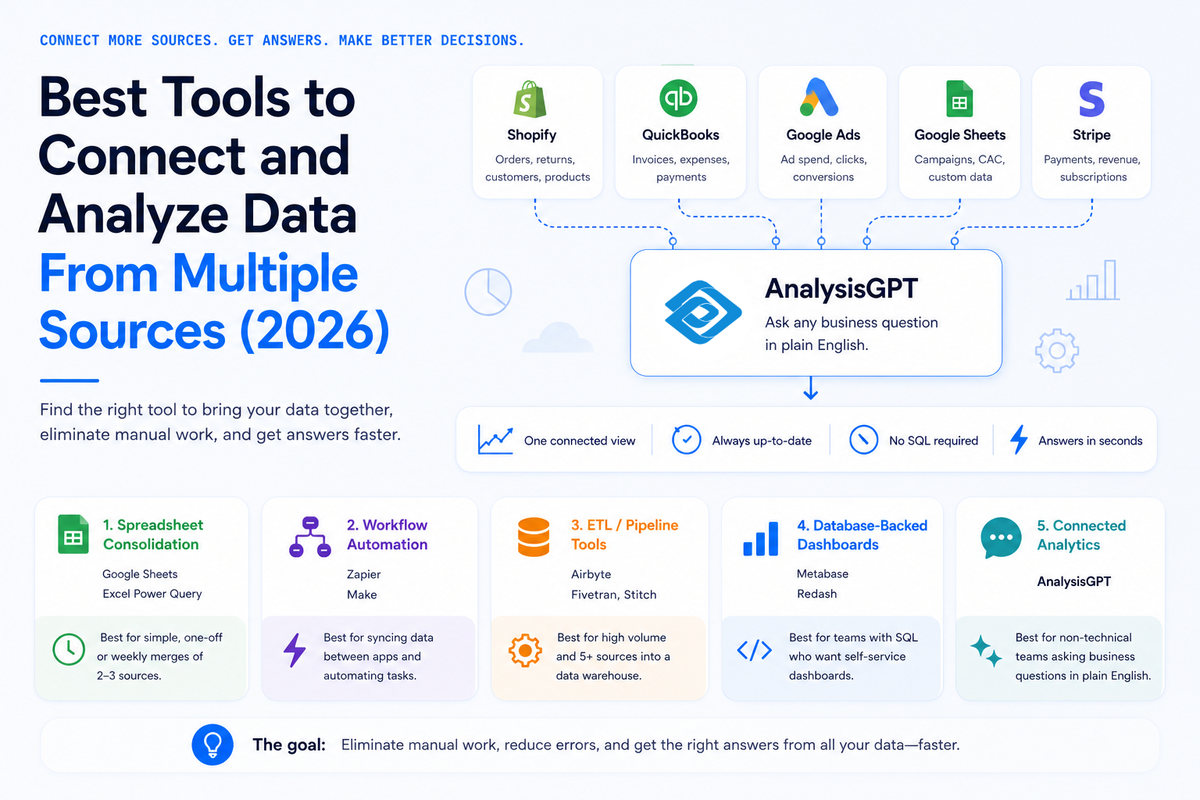
Five tool categories cover the range of needs SMB teams encounter when combining data. The right category depends on how many sources you have, how often you need answers, and whether your team writes SQL.
Spreadsheet consolidation fits teams that need a one-off or weekly merge of a few files. Google Sheets IMPORTRANGE pulls data from other sheets automatically. Excel Power Query handles larger local files and basic transformations. Both work well when the question is simple and the data doesn't need to be fresh.
Workflow automation fits teams that need records to stay in sync across apps. Zapier and Make trigger actions when events happen (a new Shopify order creates a row in your tracker, for example). The strength is real-time event handling. The limit is that these tools move records, not answer questions. You still need a place to analyze the combined data.
ETL and pipeline tools fit teams with five or more data sources, high row volumes, or a data warehouse already in place. Airbyte, Fivetran, and Stitch extract data from source systems, transform it, and load it into a central warehouse. Setup requires technical knowledge, and ongoing maintenance isn't trivial, but for organizations that need a single source of truth at scale, a pipeline is the right infrastructure.
Database-backed dashboards like Metabase and Redash fit teams that have a database (or warehouse) and at least one person comfortable with SQL. These tools provide self-service querying and visualization on top of an existing data store. They assume the data is already centralized, so they pair with ETL tools rather than replacing them.
Connected analytics fits non-technical SMB teams that need to ask recurring business questions across their existing tools without building a warehouse or writing queries. Some connected analytics tools query sources directly and return answers in plain language, skipping the intermediate warehouse and export step.
How to choose the right category for your situation
Four questions sort most SMB teams into the right tool category within a few minutes.
How many data sources do you need to combine? Two to three sources that you merge once a week? Spreadsheet consolidation handles that. Five or more sources with growing volume? A pipeline tool earns its setup cost.
Does your team write SQL? If yes, a database-backed dashboard like Metabase or Redash gives your analysts direct access. If no, you need a tool that doesn't require query language skills.
How fresh does the combined data need to be? If last week's snapshot is fine, a spreadsheet merge works. If you need up-to-the-hour accuracy across sources, you need either event-based syncs or a tool that queries sources directly.
Are your questions recurring or one-off? A one-time merge for a board deck is different from "every Monday, show me last week's revenue by channel matched against ad spend." Recurring cross-source questions justify a more permanent connection between your tools.
Most SMB teams without a data engineer land in one of two places: workflow automation (Zapier, Make) for keeping records synced, or connected analytics for asking questions across tools without an export step. The deciding factor is whether you need data movement or data answers.
Common pitfalls when combining data from multiple tools
Five mistakes show up repeatedly when SMB teams try to merge data across sources.
Treating spreadsheets as a database. Spreadsheets are built for calculation, not for storing and querying thousands of rows from multiple sources. In October 2020, Public Health England lost approximately 16,000 COVID-19 test results because the data exceeded Excel's row limit. The incident illustrates a general risk: spreadsheet tools have structural constraints that don't surface until you hit them.
Ignoring schema drift. Source systems change their data structures without warning. A Shopify product category rename, a QuickBooks field update, or a CRM migration can break a manual merge process overnight. Any approach that relies on fixed column mappings needs a maintenance plan.
Underestimating ongoing maintenance. A first merge takes an hour. Repeating that merge weekly for six months takes 26 hours, plus the time spent fixing breaks. Gartner (2020) estimates that poor data quality costs organizations an average of $12.9 million per year, and manual cross-source work is one way data quality problems show up in small teams.
Solving a recurring question with a one-time export. If you find yourself re-running the same merge every week, the question is recurring and deserves a persistent connection, not a repeated export.
Choosing a tool that requires skills your team doesn't have. A powerful BI platform that requires SQL and a data warehouse doesn't help an operations team that needs answers today. Match the tool to the team's actual capabilities, not the team you plan to hire next quarter.
Three approaches matched to where you are today
Manual consolidation (free, minimal setup)
Google Sheets IMPORTRANGE and Excel Power Query let you pull data from multiple files into a single view without additional software costs. IMPORTRANGE works well for two to three Google Sheets that update on a shared cadence. Power Query handles larger files and supports basic cleanup steps like removing duplicates and reformatting dates.
The fit: small teams with two to three data sources, weekly or monthly reporting cycles, and tolerance for data that's a few days stale. The tradeoff is time. Every manual step is a recurring cost, and error rates increase with the number of sources. Panko (2008) found that 88% of spreadsheets with formulas contained errors, so validation matters at every step. Spreadsheet consolidation breaks down when you exceed three or four sources, when the same merge runs weekly, or when multiple team members need the same report at different times. At that point, the zero-dollar cost is misleading because the time cost grows faster than the complexity.
Automation and pipelines (paid plans scale with usage)
Zapier and Make handle event-based syncs: a new order in Shopify triggers a row in your Google Sheet or a record in your CRM. These tools have free tiers for low-volume use and paid plans that scale with the number of tasks and connections.
For higher-volume needs, Airbyte, Fivetran, and Stitch move data from source systems into a warehouse on a schedule. Setup is more involved (you need a destination warehouse and someone to configure the connections), but the result is a centralized data store that downstream tools can query.
Metabase and Redash sit on top of that warehouse (or any existing database) and provide SQL-based querying and visualization. Both offer free, open-source editions. The fit: teams with at least one SQL-capable person who wants self-service dashboards built on a centralized data store. Metabase and Redash focus on querying and visualizing data that's already been collected and organized. In their standard configuration, Metabase and Redash are not designed for direct SaaS tool connections or plain-language query interfaces.
Connected analytics (purpose-built for cross-source questions)
AnalysisGPT queries connected data sources directly, which means your team asks questions instead of building pipelines. The platform supports database connections, Excel/CSV upload, and a native Shopify connector, with QuickBooks and Square integrations in progress. AnalysisGPT is built for non-technical SMB operators who need answers across connected business tools without SQL or dashboard setup.
Julius AI takes a different approach, focusing on analysts who upload datasets for AI-assisted exploration. The fit depends on your workflow: Julius AI works well for individuals running ad hoc analysis on files they already have. AnalysisGPT fits teams that need ongoing, plain-language access to data across live business tools.
The tradeoff at this tier is connector coverage. Purpose-built connected analytics platforms are newer and support fewer integrations than established ETL tools. Before committing, check that the specific sources your team relies on are supported. Connected analytics is not the right fit for teams that already have a data warehouse and a dedicated analyst; those teams get more value from a traditional BI tool like Tableau or Looker that connects to their existing warehouse.
Get started
AnalysisGPT is one option to evaluate for teams that need to ask plain-English questions across connected business tools. It supports database connections, Excel/CSV upload, and native Shopify connections, with QuickBooks and Square in progress. No SQL, no dashboards to build. See how it works at analysisgpt.ai.