
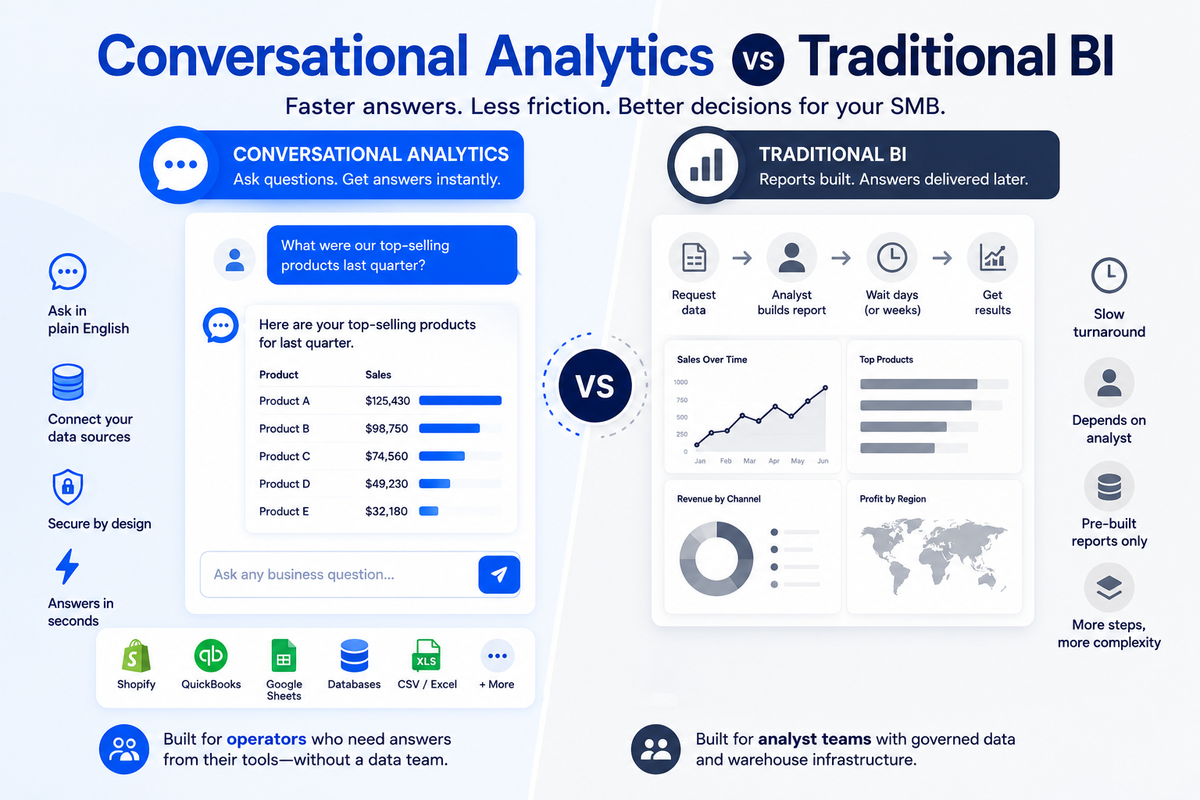
"What were our top-selling products last quarter?"
For most small and mid-sized businesses (SMBs), answering that question means exporting data from Shopify, opening a spreadsheet, building a pivot table, and hoping the numbers match what someone else pulled last week. The whole process takes an hour or more, and by then, the meeting has moved on.
The friction is not unusual. According to O'Reilly's 2025 report on data infrastructure, 57% of analytics and data professionals spend most of their time maintaining or organizing datasets, not analyzing them. For a team without a dedicated analyst, that prep time only grows.
Conversational analytics is a different approach to working with business data. Instead of writing SQL queries or building dashboards, you type a question in plain English and get an answer back as a chart, table, or sentence. The term describes tools that let anyone ask questions of their data directly, without code or technical setup.
With traditional business intelligence (BI), someone builds the dashboard or data model first, and the operator consumes the result later. Conversational analytics flips that sequence: the operator asks the question directly, and the tool handles the query.
Not to be confused with conversation analytics, which analyzes recorded customer interactions like calls and chats for sentiment and intent. Conversational analytics, as used here, means asking business-data questions and getting structured answers, not analyzing recorded conversations.
Key takeaways
- Conversational analytics lets you ask business questions in plain English instead of writing SQL or waiting for an analyst.
- It works best when your data is already reasonably clean and connected. It does not fix messy data; it queries it.
- For SMBs without a data team, conversational analytics can close the gap between having data and using it for decisions.
How conversational analytics works (without the jargon)
Conversational analytics translates a plain-language question into a database query, runs it, and returns the result in a format you can read.
Here is what happens when you type "Which product category had the highest return rate last quarter?" into a conversational analytics tool:
- The system reads your question. A natural language processing (NLP) layer identifies what you're asking: the metric (return rate), the dimension (product category), and the time frame (last quarter).
- It writes a query. The system translates your question into a structured database query (typically SQL). You never see this step, but it is the core of how the tool works.
- The query runs against your data. The system connects to your database, spreadsheet, or business tool and pulls the relevant records.
- You get an answer. The result comes back as a chart, a table, or a plain-language sentence. Some tools let you follow up with another question to refine the result.
Accuracy is strongest on simple, well-structured questions and weaker on ambiguous or multi-step questions. Asking "What were last month's sales?" works reliably. Asking "Compare this quarter's margin by product line to the same quarter last year, excluding returns" involves multiple joins and filters, and the answer may need verification.
How conversational analytics compares to traditional BI
Traditional BI and conversational analytics solve the same problem (getting answers from business data) through different approaches. The right fit depends on your team, your data, and how you ask questions.
Traditional BI fits if you already have modeled data, repeatable dashboards, and someone to manage the BI layer. Conversational analytics fits if non-technical operators need ad-hoc answers from connected business data without waiting for an analyst to build a report.
What four SMB roles do with conversational analytics
Conversational analytics replaces manual data pulls with typed questions that return instant answers. The value shows up differently depending on the role, but the pattern is the same: a question that used to take an hour now takes seconds.
Ecommerce founder
The question: "Which products had the highest return rate last quarter?"
The manual alternative: export order data from Shopify, match it against return records in a separate spreadsheet, build a pivot table, and manually calculate percentages. That process can take 45 minutes to an hour, depending on data volume.
With conversational analytics: type the question, get a ranked table in seconds. The founder sees the answer immediately and, depending on the tool, can follow up ("What's the return rate by sales channel?") without starting over.
Services operations lead
The question: "How does this month's billable utilization compare to our target?"
The manual alternative: pull time-tracking reports from the project management tool, export to a spreadsheet, filter for billable hours, calculate the percentage, and compare against the quarterly target. That typically takes 30 to 45 minutes every week.
With conversational analytics: ask the question, get a percentage and a comparison chart. The ops lead spends five minutes reviewing results instead of 40 minutes building them.
Marketing manager
The question: "Which campaign drove the most qualified leads last month?"
The manual alternative: export lead data from HubSpot, cross-reference with CRM records to filter for qualified status, group by campaign source, and build a summary table. That process can take one to two hours, depending on CRM complexity.
With conversational analytics: ask the question, get a ranked list with lead counts by campaign. Follow up with "What was the cost per qualified lead for the top three?" without rebuilding the export.
Finance lead at a 50-person company
The question: "What's our cash runway if revenue stays flat?"
The manual alternative: pull revenue data from QuickBooks, expense data from multiple sources, build a projection model in Google Sheets, and update it every month. That typically takes two to three hours per update.
With conversational analytics: ask the question against connected financial data. Some tools can surface the data inputs for a runway estimate or run simple what-if scenarios, though runway forecasting involves assumptions that go beyond querying connected data. The tool gives you faster access to the numbers; the financial judgment is still yours.
Where conversational analytics works well (and where it doesn't)
Conversational analytics handles recurring, structured-data questions well and struggles with ambiguous terms, messy data, and complex multi-step queries.
Where it works well
- Recurring questions about structured data: Questions you ask weekly or monthly ("What were last week's sales by region?") are exactly what these tools handle best.
- Ad-hoc questions that don't justify a dashboard: One-off questions ("Did we hit our hiring target this quarter?") get answers in seconds instead of requiring a new report.
- Teams without SQL skills or a dedicated analyst: Non-technical operators can get answers directly instead of waiting for someone else to pull the data.
- Speed: A question that takes 30 minutes to answer manually can often be answered in seconds or minutes with a conversational analytics tool, assuming clean data.
Where it doesn't work well
- Ambiguous business terms: "Revenue" means different things to different departments. If your accounting team and your sales team define it differently, the tool picks one definition and may give you the wrong number.
- Complex multi-step questions: Questions involving multiple joins, time-period comparisons, and nested filters often produce inaccurate results. Simpler questions get better answers.
- Unstructured or disconnected data: 45% of medium-sized SMBs (100 to 249 employees) say they need improvement in effectively managing and using their data, according to GTIA's 2025 SMB technology report. Conversational analytics can't fix data that lives in disconnected spreadsheets and unlinked SaaS tools. It queries what's there.
- Questions requiring human judgment: "Should we expand into the Northeast?" involves market context, team capacity, and strategic priorities that no query engine can answer. Conversational analytics gives you the data inputs; the judgment is yours.
- Over-trust in AI answers: A plain-language answer sounds confident whether it's right or wrong. Users who skip verification may act on a misinterpreted question.
How to evaluate if conversational analytics is right for your business
Conversational analytics fits your business if your team regularly answers the same data questions manually and your data lives in connected systems. Almost 60% of small businesses now use AI for business operations, more than double the rate in 2023, according to the U.S. Chamber of Commerce's 2025 technology report. Growing AI adoption across small businesses suggests comfort with these tools is increasing, though each team's readiness depends on its own data situation. Four questions can help:
Do you have recurring data questions that someone currently answers manually? If your team spends hours each week pulling the same reports or answering the same questions from leadership, conversational analytics can handle that work in seconds. If your data questions are rare or one-off, the investment may not pay back.
Is your data in systems that can be connected? If your data lives in QuickBooks, Shopify, Google Sheets, HubSpot, or a database, most conversational analytics tools can connect to it. If your data is scattered across dozens of disconnected spreadsheets with no consistent structure, you need to organize it first.
Does your team wait hours or days for answers that should take minutes? Long wait times for data answers usually mean the bottleneck is access, not analysis. Conversational analytics removes that bottleneck by letting anyone ask directly.
Would faster answers change your decisions? If your decisions are blocked by something other than data (budget constraints, team alignment, market timing), faster data access won't help. Conversational analytics is most valuable when data is the missing piece, not one of many missing pieces.
Tools that offer conversational analytics
Conversational analytics tools fall into three categories, each suited to a different level of data maturity and team size. One caveat applies to all three: conversational analytics is not a fix for messy data. It works when your source systems are connected and key fields (dates, product names, customer IDs) are reasonably consistent across tools.
Embedded natural language features in existing BI tools
If your team already uses a BI tool, you may already have access to conversational analytics without buying anything new. Power BI includes Q&A, and Looker now includes Conversational Analytics powered by Gemini. Tableau retired its Ask Data feature in 2024 and replaced it with Tableau Pulse, which takes a different approach to surfacing insights. You type a question into a search bar within the tool, and it generates a visualization or table from your existing data models.
Best for organizations that already have a BI stack, a data team, and modeled data. The natural language layer adds convenience to an existing setup, with no additional cost beyond your current license in many cases. If your team already runs Power BI or Looker, turning on the natural language query feature is the lowest-lift way to try conversational analytics.
The natural language feature is an add-on, not the core product. Accuracy varies based on how well the underlying data model is configured, and someone still needs to build and maintain that model. If you do not already have a BI platform, this category does not apply.
Standalone AI analytics platforms
ThoughtSpot (Spotter) and Sigma Computing offer analytics platforms built around search and AI. ThoughtSpot and Sigma are purpose-built for interactive data exploration, not dashboard construction. They sit between traditional BI and the lighter-weight connected tools, offering more analytical depth while requiring more data maturity.
Best for mid-market teams that want self-serve analytics without building dashboards from scratch, and that have reasonably clean data in a warehouse or structured database. These platforms work well when your company has outgrown spreadsheets but does not want to hire an analyst team to build and maintain a full BI stack.
Pricing and onboarding complexity can exceed what most SMBs need or can budget for. Sigma and ThoughtSpot assume a level of data maturity (clean schemas, connected warehouses) that smaller businesses may not have yet.
Connected analytics tools for non-technical operators
This category includes tools designed for teams without analysts or SQL skills. They connect to the data sources businesses already use, including databases, spreadsheets, and SaaS tools, and let users ask questions directly. AnalysisGPT fits here, alongside other platforms focused on plain-language data access for small teams. You connect your data, type a question, and get an answer without writing code or configuring a data model first.
Best for SMBs that want answers from their existing data without building a warehouse or ETL pipeline first. If your team's biggest bottleneck is access to answers rather than the complexity of the analysis, a connected analytics tool answers your question directly without requiring dashboard setup.
These tools work best when your data has consistent column names, clean formatting, and a logical structure. If your data is messy or spread across dozens of unconnected sources with no shared identifiers, you may need to consolidate before a connected analytics tool can deliver reliable answers. For most SMBs without a data team, this category is the most likely fit.
AnalysisGPT is one option to evaluate if your team fits the connected-analytics profile. It connects to the data sources you already use and lets you ask business questions in plain language. Learn more at analysisgpt.ai.