
Most startups don’t have a data shortage. They have sales data in Stripe or Shopify, marketing data in HubSpot or Google Ads, finance data in QuickBooks, and extra reporting buried in spreadsheets. At first, one person can pull those numbers together manually to track basics like revenue and marketing performance. But as the business grows, it gets harder to answer questions like which channels drive revenue, whether customer acquisition costs are rising, or whether marketing and finance are working from the same numbers.
Business intelligence (BI) tools help startups connect reporting across sales, marketing, and finance data so they can track performance, spot trends earlier, and spend less time rebuilding the same reports every week.
This guide compares seven BI tools that fit different startup stages, budgets, and technical skill levels. You’ll learn which tools are easiest to set up, which stay affordable as teams grow, and which are best suited to startups that need useful answers quickly without building a complex data stack.
Key takeaways
- The right business intelligence (BI) tool connects data from multiple systems to generate reports faster and reduce the manual work that often slows down critical decision-making.
- Price matters, but time-to-value matters more because a tool that takes weeks to set up creates hidden costs in lost productivity and extra technical work before it ever delivers insights.
- The best tool depends on your stage, budget, and technical capacity. You need to match the tool to your current team’s skills to avoid bottlenecks where only one or two people are able to pull reports.
- Startups at the Seed or Series A stage usually get the most value from tools that are quick to set up. Because these teams are often operating without a dedicated analyst, they need tools that allow non-technical members to pull their own reports without a long implementation period.
What startups should look for in a BI tool
Choose a BI tool based on your startup’s funding and growth stage and what your team is likely to need over the next 12 months. Reporting needs can change quickly, and replacing a BI tool mid-growth is usually more painful than choosing one that can support your next stage from the start.
Cost at different team sizes
Model the cost for where you are now and where you expect to be in 12 months. Some tools stay affordable for small teams but get expensive as you add more users, while others charge flat rates no matter how many people need access.
When comparing tools, map the cost at 5, 20, and 50 users so you can see how pricing changes at each stage. This also helps you avoid choosing a tool that looks inexpensive now but becomes much harder to justify as the team grows.
Time to value
Ask yourself, “How long will it take from the time we sign up until the time we can produce a useful report?” Some tools can deliver answers within minutes of signup, while others require weeks of data modeling and dashboard configuration before they become productive.
If you’re moving fast and need answers now, look for a tool that lets you get started by simply uploading a spreadsheet or linking your database.
Technical requirements
Choose a tool with setup and maintenance requirements your team can realistically support. Some BI tools are easy to start using, while others require data modeling, SQL knowledge, or engineering support before they become useful. For a ten-person startup with no technical hires, a tool that needs a data engineer just to get started is usually the wrong fit.
Scalability
Choose a BI tool that can handle more users, more data sources, and more complex reporting needs as your startup grows. The goal is not to buy an enterprise platform too early, but to avoid a tool you will outgrow within a year.
The 7 best business intelligence tools for startups
These seven tools cover a broad range of startup BI needs, from free open-source dashboards to AI-powered conversational analytics, so you can find the option that best fits your team, budget, and technical needs.
1. AnalysisGPT
Best for: Non-technical startup teams that need business answers without building complex data infrastructure.
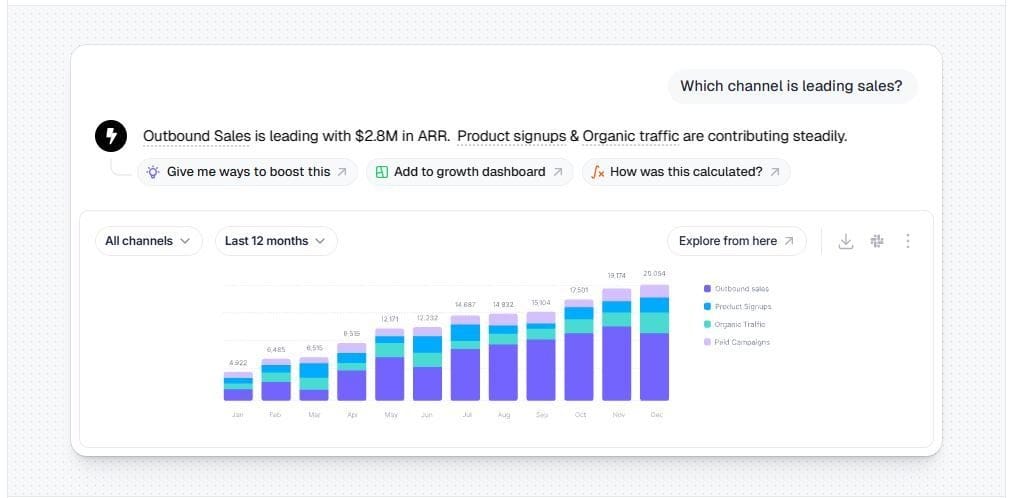
AnalysisGPT is a conversational analytics platform built for teams that want answers without a complex data setup. Users can get plain-language answers to business questions by connecting a database or uploading an Excel or CSV file.
Since the platform doesn’t require extract, transform, and load (ETL) pipelines, teams can skip the extra work of moving and restructuring data before they run reports.
Key features
- Natural language queries: Ask business questions in plain language and get answers without SQL knowledge.
- Free Excel/CSV upload: Test the platform by dragging and dropping files.
- Cross-source analysis: Connect multiple data sources and get unified answers in one place.
- No-ETL architecture: Skip the data pipeline setup that slows traditional BI.
- Data security: The model only receives metadata, not your underlying data. It uses read-only access to answer questions while your data stays in your existing systems.
Startup stage
Strong for pre-seed through Series A teams without dedicated data hires. AnalysisGPT removes the need for a traditional BI stack, including a data warehouse, ETL pipelines, and SQL. For startups that have not yet invested in data infrastructure, it offers one of the fastest paths to getting answers.
Considerations
AnalysisGPT is still early-stage. It already supports database connections, and Excel and CSV upload provide an easier entry point, but native integrations for tools like Shopify and Square are still coming.
Pricing: Free trial available. Paid plans start at £20 every 30 days, with custom enterprise pricing available through sales. Try AnalysisGPT free
2. Metabase
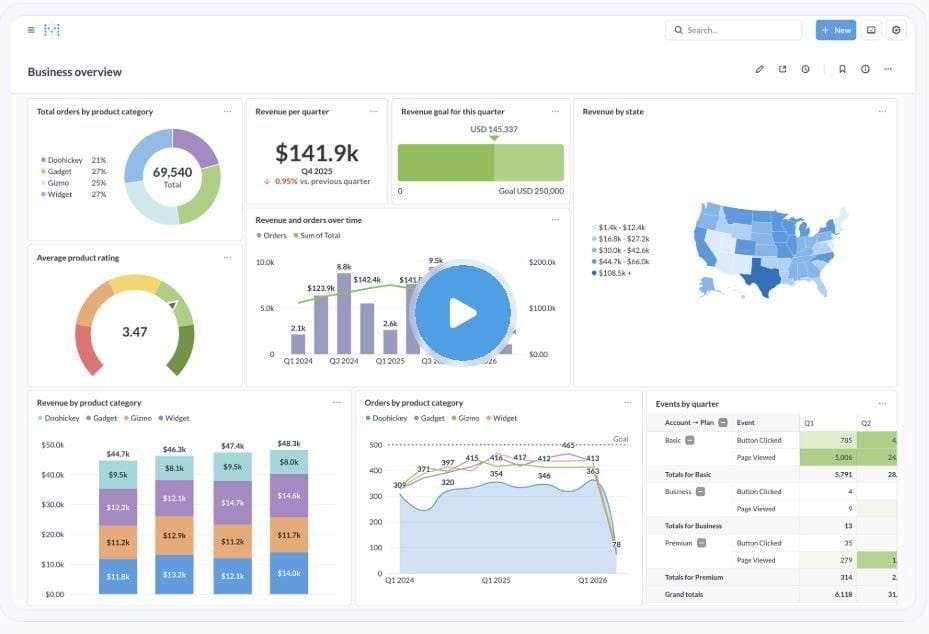
Best for: Startups that want open-source business intelligence with an easy self-service setup.
Metabase is an open-source business intelligence platform whose easy setup and navigation make it a popular choice for startups. It includes an “Ask a Question” feature for natural language queries, and non-technical users can build reports without writing SQL.
Key features
- Open-source platform: Self-host Metabase for free and customize it to fit your team’s needs.
- “Ask a Question”: Use natural language queries to build reports.
- No-SQL reporting: Non-technical users can build reports and explore data without writing code.
- Community support: Use Metabase’s active community and strong documentation to troubleshoot setup and usage.
Startup stageMetabase is a strong option for startups from pre-seed through Series B, especially if they have at least one technical team member who can handle the initial setup. Free self-hosting makes it appealing for budget-conscious teams, while paid cloud plans remain accessible for many early-stage companies.
ConsiderationsMetabase works best when connected to operational databases such as PostgreSQL, MySQL, or Snowflake, where teams want to build recurring dashboards and reports. It’s less suited to quick one-off analysis from uploaded spreadsheets or CSV files. Self-hosting also requires technical setup and ongoing maintenance.
Pricing: Free to self-host. Paid cloud plans start at $100/month for five users, and the Pro plan starts at $575/month for the first 10 users.
3. Microsoft Power BI
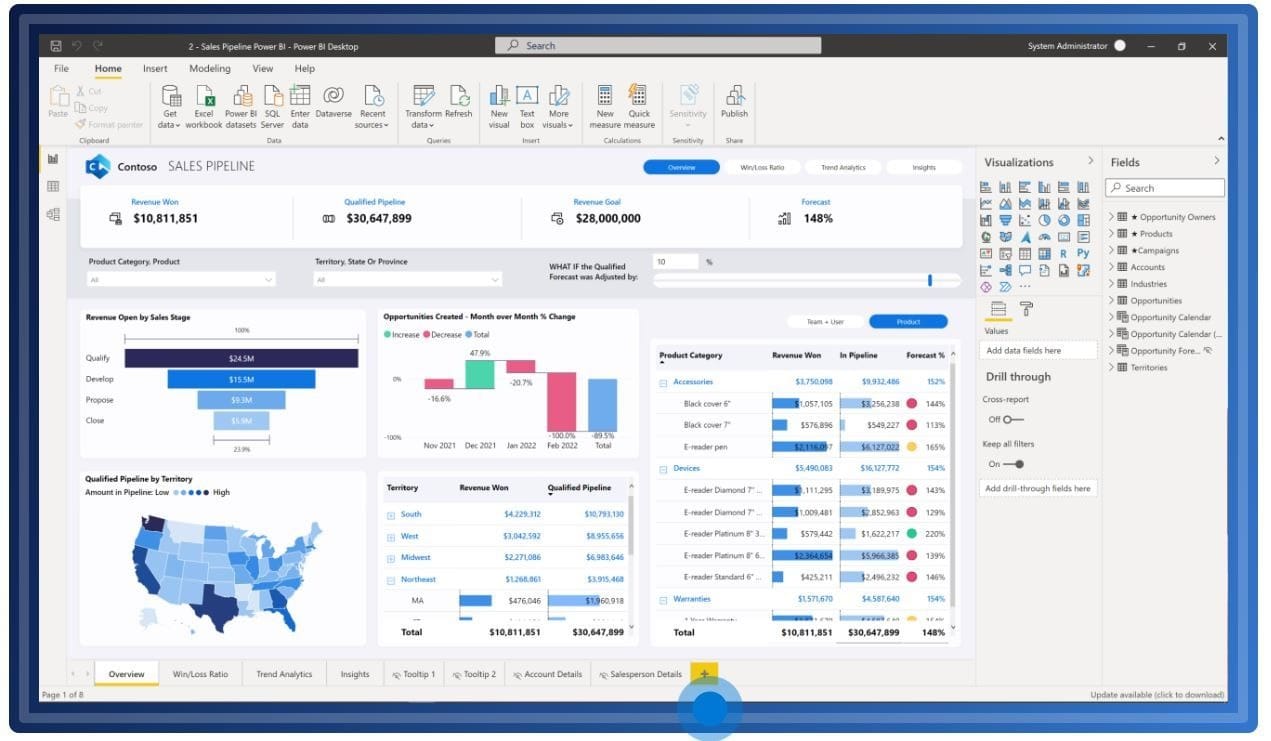
Best for: Startups in the Microsoft ecosystem that want the least expensive path to enterprise-grade BI.
Power BI is Microsoft’s business intelligence platform. Its free Desktop version gives individual users a strong starting point, while Pro adds the sharing and collaboration most teams need. It also lets users explore data by asking questions in plain language, and Copilot adds AI support for generating insights.
Key features
- Free Desktop version: Use a powerful free version for individual reporting and analysis.
- Copilot AI and Q&A: Use AI-assisted insights and natural language queries to explore data more quickly.
- 100+ data connectors: Connect Power BI to a wide range of data sources across your business, including Excel, SQL Server, Salesforce, and Google Analytics.
- Excel integration: Work in a reporting environment that feels familiar for finance teams already using Excel.
Startup stage
Power BI is a good option for startups already using Microsoft 365, Teams, or Azure. Its low per-user pricing makes it affordable as teams grow, especially for companies already working inside the Microsoft ecosystem.
Considerations
Setup and data modeling can take time without technical experience. The free Desktop version does not support sharing or collaboration, so most teams will need Pro once more than one person needs access.
Pricing: A free account is available for individual use. Power BI Pro starts at $14 per user per month, while Premium Per User starts at $24 per user per month.
4. Google Looker Studio
Best for: Google-centric startups that want free dashboards with no budget commitment.
Looker Studio is Google’s free dashboard and reporting tool. It connects natively to Google Analytics, Google Ads, Google Sheets, and BigQuery.
Key features
- Google ecosystem integration: Connect directly to Google marketing and data tools without third-party middleware.
- Connector gallery: Access over 800 partner and community connectors to pull data from external platforms such as Facebook Ads, Instagram Insights, and YouTube.
- Gemini AI integration: Create formulas and basic visualizations with built-in AI assistance.
- Automated reporting: Schedule reports to be sent via email or Google Chat on a recurring basis.
Startup stage
Google Looker Studio is a good match for any early-stage startup that already relies on Google Workspace. Its zero-cost entry point allows founders to build basic reporting without adding a new software expense.
Considerations
Looker Studio remains a visualization-first tool rather than a chat-native platform. While the Gemini integration allows for some natural language queries, the core experience still requires manual dashboard construction and data modeling knowledge.
Pricing: The standard version is free for creators and report viewers. Looker Studio Pro costs $9 per user per month, and some third-party connectors require added monthly fees.
5. Zoho Analytics
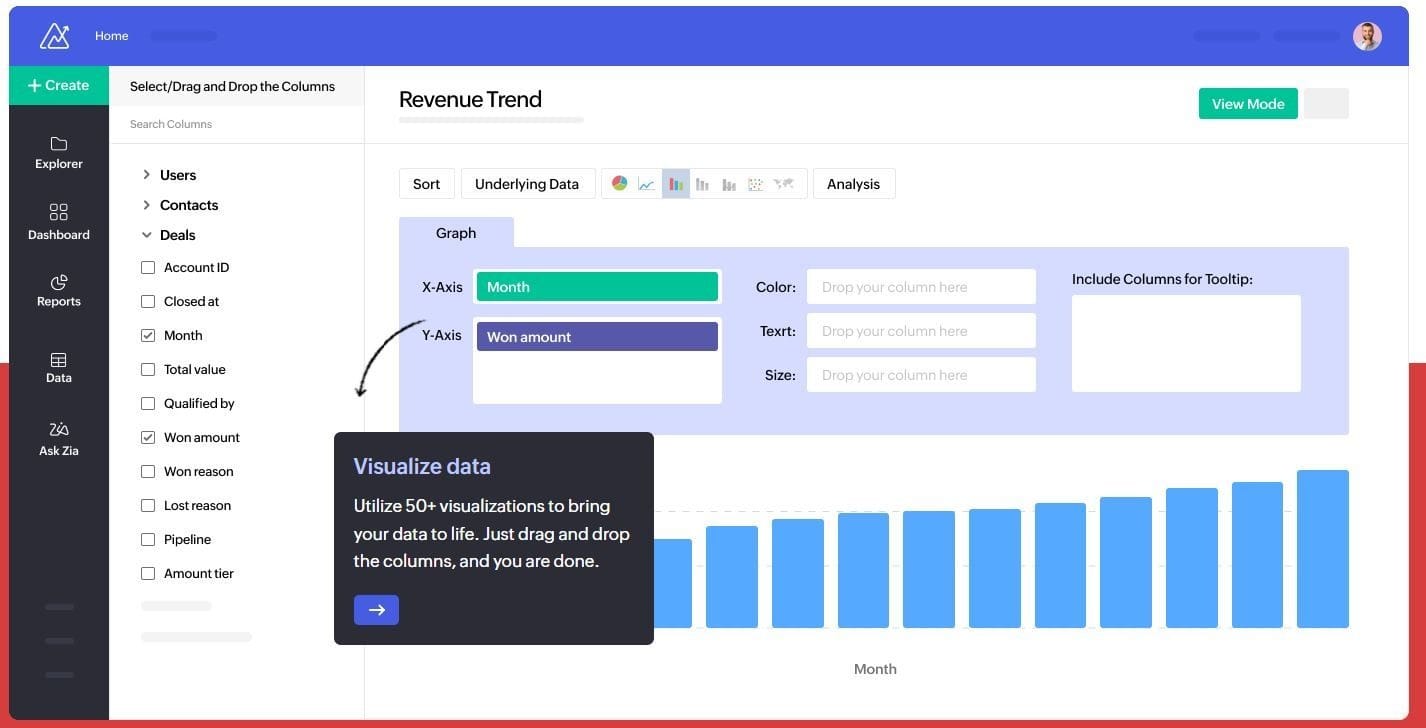
Best for: Budget-conscious startups that want a full analytics platform and already use Zoho products, such as Zoho CRM, Zoho Books, or Zoho Desk.
Zoho Analytics gives startups a way to build reports, track performance, and explore data without paying for an enterprise platform. Its built-in AI assistant, Zia, can answer questions, flag unusual patterns, and suggest ways to visualize the data.
Key features
- Zia AI assistant: Ask questions in plain language, spot anomalies, and get suggestions for charts and reports.
- Drag-and-drop report builder: Build dashboards and reports without heavy technical work.
- Data blending: Combine data from multiple sources, such as CRM, finance, and marketing platforms, in one place for unified reporting.
- Mobile-friendly dashboards: View dashboards and reports on the go.
Startup stage
Zoho Analytics is a strong option for startups that want more built-in analytics features than a basic dashboard tool can offer, but still need pricing that stays accessible. It’s especially appealing for teams already using Zoho products such as Zoho CRM, Zoho Books, or Zoho Desk.
Considerations
Teams outside the Zoho ecosystem may get less value from the platform’s built-in integrations. Some AI features are stronger in higher-tier plans, and startups new to BI should expect to spend time connecting data sources, setting up dashboards, and learning how to structure reports.
Pricing: Paid plans start at $48 per month for five users. Premium plans start at $115 per month for 15 users.
6. Lightdash
Best for: Engineering-led startups that want open-source reporting tied to their existing code.
Lightdash is a business intelligence tool designed for teams that manage data through code. It operates as a reporting layer on top of the data build tool (dbt) software used to transform raw data before it is analyzed.
Key features
- Open-source core: Self-host the software for free to maintain full control over the data environment.
- Native dbt integration: Convert existing dbt models directly into interactive charts and tables.
- AI co-pilot: Explore data and generate visualizations using natural language prompts.
- Version control support: Track and review changes to reporting logic over time using systems like GitHub.
- Code-based metrics: Define business logic once in code to ensure consistency across the organization.
Startup stage
Lightdash is an excellent option for developer-heavy startups already using dbt. It lets engineers manage reporting through the same code-based workflow they use for software.
Considerations
The platform requires an active dbt project to function. Self-hosting also requires technical skills to set up and maintain software on servers, and the interface remains difficult for non-technical users to navigate independently.
Price: The open-source version is free to self-host. Paid cloud plans start at $2,400 per month and include unlimited users.
7. Tableau
Best for: Well-funded startups with data-literate teams requiring advanced visualization.
Tableau is the industry-standard data visualization platform owned by Salesforce. It produces the most sophisticated charts, maps, and interactive dashboards.
Key features
- Industry-leading data visualization: Create customized charts, maps, and interactive dashboards.
- Tableau Pulse: Receive automated metric summaries and AI-generated insights through email or Slack, so teams can monitor changes without opening Tableau.
- Community resources: Access an extensive library of templates, training programs, and third-party plugins that can help teams learn the platform faster and extend its functionality over time.
- Salesforce integration: View data within the Salesforce ecosystem for sales performance tracking.
- Presentation-ready reporting: Produce polished visualizations for board meetings and updates.
Startup stage
Tableau is best for well-funded Series A+ startups with dedicated data analysts. High licensing costs and significant setup time make it a heavy investment for most early-stage organizations.
Considerations
The platform has a steep learning curve and requires specialized training. Without existing Tableau expertise, the high Creator license costs are difficult to justify.
Pricing: Tableau Cloud requires an annual contract and at least one Creator license: Standard edition $75/month or Enterprise edition $115/month, billed annually. Standard plans start at $15 per user per month, while Enterprise plans start at $35 per user per month.
How to choose the right BI tool for your startup
Choose a tool that fits your current stage and team capacity, rather than overcommitting to a more complex setup too early.
Pre-seed and seed stage
At this stage, you probably don’t need a dedicated business intelligence tool yet. Google Sheets or free tools like Looker Studio can handle many early reporting needs.
If you want to move beyond spreadsheets without building infrastructure, AnalysisGPT or Metabase are two of the lowest-friction ways to get started.
Series A
At Series A, reporting complexity grows. With more tools generating data and more questions from investors and department heads, manual workarounds are no longer sustainable.
This is the point at which a dedicated business intelligence tool can start paying for itself. Metabase, Power BI, or Zoho Analytics are all strong options depending on your tech stack.
If your team is non-technical, AnalysisGPT offers a faster path by letting users ask questions in plain language instead of building dashboards first.
Series B and beyond
By Series B, you may already have a data hire or be actively looking for one. More technical tools like Lightdash become realistic if your team already works in dbt, while Tableau can make sense if you have the budget and in-house skills to support it.
At this stage, the question is no longer just whether you can afford business intelligence. It is whether your current tool can keep up with a larger team, more data sources, and more complex reporting needs.
FAQs
What is business intelligence software?Business intelligence software connects to data from systems like CRMs, accounting tools, and spreadsheets, and then turns that information into dashboards, reports, and charts that teams can use to make decisions.
What’s the difference between BI tools and AI analytics platforms?
BI tools are mainly used to analyze historical data and show what has already happened through reports, dashboards, and charts. Their advantage is that they give teams a clear, reliable way to track performance and answer day-to-day business questions. AI analytics platforms go further by using data to forecast likely outcomes, identify patterns, and support more automated decision-making, but they often require more setup, oversight, and trust in the model.
When should a startup invest in a BI tool?A BI tool becomes valuable when your team can no longer get reliable answers quickly from the systems and spreadsheets you already use.
Do startups need a data team to use BI tools?Not always. Some BI tools are built for technical teams, while others are designed for founders and operators who need answers without SQL, ETL pipelines, or a dedicated data hire.
What is the best free BI tool for startups?It depends on your workflow and technical needs. Google Looker Studio works well for free dashboarding, Metabase offers a free option for teams that can support self-hosting, and AnalysisGPT provides a free way to answer questions from spreadsheets without building dashboards first.
Start analyzing your data today
The right business intelligence tool depends on your team, your stage, and how much setup work you are willing to take on.
For startups that want answers without dashboards, SQL, or a complex data setup, AnalysisGPT offers one of the fastest ways to get started. Connect a database or upload an Excel file, ask a business question, and get answers in minutes.