AnalysisGPT and Datapad get recommended in the same conversations, but they solve different problems. SMBs run an average of nine cloud tools (Mordor Intelligence, 2025), and the silos between them force manual re-entry and errors.
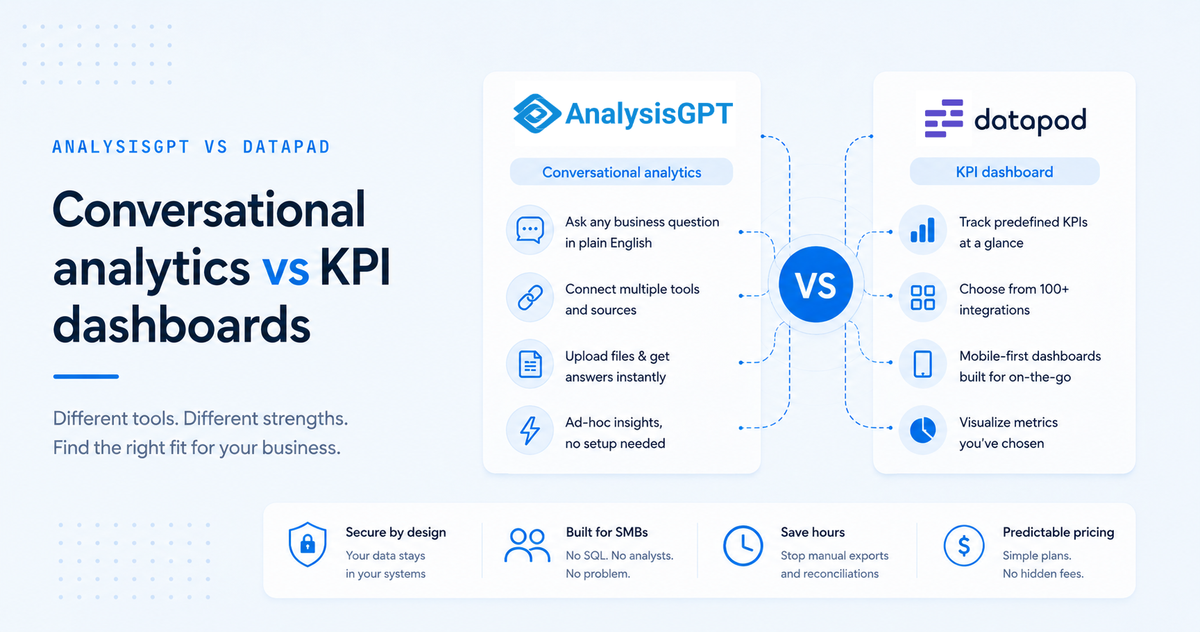
AnalysisGPT is conversational analytics - answers plain-English questions across multiple business systems. Datapad is a KPI dashboard tool for metrics you've already chosen to track. Both serve SMB operators without a dedicated analyst.
This guide compares them across five dimensions - cross-source querying, ease of use, mobile access, ad-hoc analysis, and integration fit - plus pricing and decision criteria.
Key takeaways
- Different product categories. AnalysisGPT is conversational analytics; Datapad is a KPI dashboard tool.
- Cross-source querying is the biggest architectural gap. AnalysisGPT answers questions spanning multiple tools; Datapad shows one source per widget.
- Datapad's mobile-first design suits operators checking KPIs on the go.
- Planned vs. unplanned questions. AnalysisGPT handles questions you haven't anticipated; Datapad works best for metrics you've already chosen to track.
- Both tools are accessible to non-technical users. Datapad simplifies dashboard setup; AnalysisGPT simplifies the question itself.
At-a-glance comparison
What is AnalysisGPT?
AnalysisGPT is a conversational analytics platform for non-technical SMB operators. Users connect business tools - QuickBooks, Shopify, Stripe, POS systems - or upload a spreadsheet, then ask questions in plain English. One question can pull from multiple systems at once.
AnalysisGPT sits in a different category than enterprise BI tools like Tableau or Power BI, which require technical configuration and a dedicated analyst. Operators running five or more tools without a data team get the most value.
A 2023 Gartner survey found fewer than half of data and analytics teams effectively deliver value, and 39% of leaders cited lack of available talent as their top obstacle. AnalysisGPT uses a metadata-only security architecture - raw data stays in the source system.
What is Datapad?
Datapad is a mobile-first KPI dashboard tool for teams monitoring predefined metrics in one visual interface. Users connect data sources - Google Analytics, Shopify, Facebook Ads, and others - build widgets, and track trend lines, goals, and KPIs on a phone-optimized layout. No code or SQL required.
The mobile-first design is a real differentiator. Dashboards function well on small screens, which matters for operators checking numbers between client meetings, on a job site, or during a commute.
The integration library skews toward marketing, advertising, and web analytics tools. Teams whose most important data lives in Google Analytics or Facebook Ads get useful connector breadth.
How they compare
The five sections below measure AnalysisGPT and Datapad against the decisions SMB operators face: where data lives, how questions arise, who's checking numbers and from what device, and which integrations fit the stack.
Cross-source querying
Cross-source querying is the architectural difference that separates these two tools into different categories.
AnalysisGPT:
- One question - like "Did my refund rate increase after last month's promotion?" - draws from Shopify orders, Stripe payments, and QuickBooks revenue at once
- No exporting, no manual reconciliation, no tab-switching
- The platform handles cross-system joins behind the scenes
Datapad:
- Each dashboard widget shows data from one connected source
- Cross-source views require exporting from each tool and reconciling manually, or comparing separate widgets side by side
- The dashboard model works for single-source metrics but doesn't connect data across tools
Evolution.ai's 2024 reconciliation benchmark found 42% of FP&A team time in 2023 went to data collection, reconciliation, and distribution - up from 25% in 2019. Cross-source querying eliminates most of that work.
Takeaway: Operators whose most important questions span multiple tools get a step removed by AnalysisGPT that Datapad's architecture doesn't address.
Non-technical ease of use
Non-technical ease of use applies to both tools but shows up at different stages. Datapad's ease of use is at dashboard setup (drag-and-drop widgets, color-coded KPIs). AnalysisGPT's is at the question stage (type a business question the way you'd say it aloud).
Datapad:
- Drag-and-drop widgets, color-coded KPIs, familiar chart types
- Operators trained on Google Analytics or HubSpot recognize the model immediately
- The dashboard runs itself once configured
AnalysisGPT:
- Type a question the way you'd ask a colleague; the platform returns an answer
- No widget setup, no chart-type decisions, no configuration vocabulary
- The interface is an open text field, which means you need to know what to ask
That last point is an honest tradeoff. A preconfigured dashboard presents answers without asking you to frame the question. An open text field puts the framing on you.
Takeaway: Both tools suit non-technical users. The choice comes down to whether you prefer setting things up once or asking questions as they come.
Mobile accessibility
Mobile access is Datapad's clearest advantage.
Datapad:
- Designed mobile-first: dashboards built to be checked from a phone
- KPI tiles, trend lines, and goal trackers render cleanly without pinching or scrolling
- A strong fit for operators checking metrics between meetings, on job sites, or during a commute
AnalysisGPT:
- Browser-based and functional on mobile, but not designed around the on-the-go use case
- Its strength is deeper, conversational analysis - the kind that happens at a desk
- Mobile works, but it's not where the tool shines
A meaningful share of SMB operators treat the phone as the primary screen. Field service owners, retail operators, and consultants moving between locations glance at a phone, not a laptop.
Takeaway: Teams whose primary need is a clean, preconfigured KPI view pulled up from a phone get the better fit with Datapad.
Ad-hoc and exploratory analysis
Ad-hoc and exploratory analysis is where AnalysisGPT pulls ahead. AnalysisGPT handles unplanned questions directly - type the question, get an answer. Datapad's dashboard model requires building a new view or exporting data when an unexpected question surfaces.
AnalysisGPT:
- A question like "Which product category had the highest margin last quarter, and did that change after the price increase?" can be typed directly and answered without setup
- New questions don't require new widgets, views, or exports
- The conversational model handles the unpredictable: a supplier issue, a seasonal shift, a customer complaint pattern
Datapad:
- Answering an unplanned question means building a new dashboard view or exporting data
- Works best when metrics are stable and chosen in advance
- Not a limitation of the product - it's the nature of the dashboard model
Takeaway: AnalysisGPT is built for questions you haven't thought to configure yet. Datapad is built for metrics you've already decided to watch.
Integration fit for SMB financial and operations tools
Integration fit for SMB financial and operations tools depends on which ecosystem holds your most important data. Datapad's library leans marketing and web analytics (Google Analytics, Facebook Ads, LinkedIn Ads). AnalysisGPT's native connectors target the operational core - QuickBooks, Stripe, Shopify, POS systems.
Datapad:
- Connects with marketing and web analytics tools: Google Analytics, Facebook Ads, Shopify, LinkedIn Ads
- Library skews toward marketing performance monitoring
- Strong fit for operators whose decisions revolve around ad spend and campaigns
AnalysisGPT:
- Native integrations target the financial and operational core: QuickBooks, Stripe, Shopify, POS systems
- Where revenue, expenses, and transaction-level data live
- Operators working in QuickBooks or Stripe get connections that address daily workflows
Per Ledge.co's 2025 month-end close benchmarks, finance teams cite reconciling accounts across banks, card processors, and payment systems as the most time-consuming activity in the close. Native connections reduce that burden.
Takeaway: For ad spend and web traffic tracking, Datapad's connector library is stronger. For financial and operational answers, AnalysisGPT's integration set is more directly useful.
Pricing
Both tools offer multiple tiers, from free or low-cost entry points to enterprise plans. The key structural difference: AnalysisGPT prices by workspace on a 30-day cycle; Datapad's mid-tier plan prices per user, which affects how costs scale.
AnalysisGPT pricing
AnalysisGPT offers four tiers, billed every 30 days (not calendar monthly). All paid plans include unlimited team members, unlimited queries, real-time dashboards, and AI-powered predictive analytics.
- Trial Plan - £0: Free trial with full access to Pro features.
- Excel Plan - £20/30 days: Entry tier for Excel and CSV-based analysis.
- Pro Plan - £90/30 days: Full-featured tier including database connections.
- Enterprise - Contact sales: Custom pricing with private cloud or on-premise deployment, advanced role-based access control, and unlimited custom AI agents.
Unlimited team members on the £20 tier is unusual for this category. Teams adding members who want to avoid per-seat costs should factor that in.
AnalysisGPT pricing is listed in GBP (£). Check analysisgpt.ai for current figures.
Datapad pricing
Datapad offers four tiers with monthly and annual billing. Annual billing cuts the price roughly in half.
- Basic - $30/month (monthly) or $15/month (annual): Entry-level tier.
- Pro - $50/user/month (monthly) or $25/user/month (annual): Per-user pricing, so costs scale with team size.
- Scale - $1,000/workspace/month (monthly) or $500/workspace/month (annual): Per-workspace pricing. Datapad's most popular plan.
- Enterprise - Contact sales: Custom pricing.
Datapad has no free tier. The lowest entry point is $15/month billed annually. Per-user pricing on the Pro plan matters for teams adding members - costs that look modest for a solo operator rise quickly for a team of five.
Datapad pricing is listed in USD ($). Check datapad.io/pricing for current figures.
When to choose AnalysisGPT
Choose AnalysisGPT if your questions cross tool boundaries, change frequently, or arrive without warning.
- Your data lives in five or more tools: Answers that span QuickBooks, Shopify, and Stripe without exporting CSVs. Cross-system querying handles the joins.
- Your questions change week to week: A supplier issue, a pricing change, a seasonal pattern. You can't predict next Monday's question.
- You want to upload a file and get answers immediately: A vendor spreadsheet, an accountant export, a CSV from five minutes ago.
- You don't have an analyst and don't want to build dashboards: You'd rather type "What was my gross margin last quarter by product category?" than configure widgets.
The common thread: AnalysisGPT fits operators who ask questions rather than configure dashboards.
When to choose Datapad
Choose Datapad if your metrics are stable, your team checks numbers on the go, and your most important data lives in marketing and web analytics tools.
- You've already identified your core KPIs: You know which metrics to track - MRR, ad spend ROI, conversion rate - and want a clean visual to monitor them daily.
- Mobile access is a priority: You check metrics between meetings, on job sites, or during a commute.
- Your primary data sources are marketing and web analytics: Google Analytics, Facebook Ads, LinkedIn Ads. Datapad's connector library covers these well.
- Your team prefers visual dashboards over conversational interfaces: The drag-and-drop widget model is familiar from Google Analytics or HubSpot.
The common thread: Datapad fits operators who've defined their metrics and want a reliable place to monitor them.
Frequently asked questions
What is the main difference between AnalysisGPT and Datapad?
AnalysisGPT is a conversational analytics tool that answers plain-English questions across multiple connected business systems. Datapad is a KPI dashboard tool that monitors predefined metrics visually. AnalysisGPT takes open-ended questions and pulls answers from connected tools. Datapad configures dashboards around specific KPIs from individual sources.
Can AnalysisGPT analyze data from multiple sources at the same time?
Yes. A concrete example: an operator running a Black Friday promotion can ask "Did the 20% discount on skincare drive enough volume to offset the margin hit, and did refund rates spike the week after?" - and AnalysisGPT pulls Shopify order volume, Stripe refund data, and QuickBooks cost-of-goods entries in one answer. No CSV exports, no pivot tables.
Which tool is easier to use for someone without a data or SQL background?
Both tools are accessible to non-technical users, but they simplify different parts of the process. Datapad's ease of use is in dashboard setup. AnalysisGPT's is at the question stage. The right fit depends on whether you prefer configuring views you check regularly or asking open-ended questions as they come up.
How do AnalysisGPT and Datapad differ on data security?
A practical test: if your accountant asks whether customer transaction records ever leave QuickBooks, the answer changes between the two tools. AnalysisGPT's metadata-only architecture means records stay in QuickBooks and Stripe - AnalysisGPT queries them in place. Datapad syncs data into its own system to power dashboards (standard cloud practice). Regulated industries handling PII or financial records should weigh that distinction.
Is AnalysisGPT or Datapad better for small business analytics?
AnalysisGPT fits SMB operators who need cross-system answers from tools like QuickBooks and Stripe without a dedicated analyst. Datapad fits teams that already know their core KPIs and want a visual, mobile-friendly place to monitor them. The choice depends on whether your bigger pain point is discovering insights across scattered data or tracking known metrics consistently.
Which tool is more affordable for a small team?
Check the Pricing section above for full tier breakdowns. AnalysisGPT offers a free trial with full platform access. Datapad's lowest tier starts at $30/month (or $15/month billed annually). Affordability depends on which problem your team is solving.
Try AnalysisGPT free
Businesses with data across multiple tools can start with a free AnalysisGPT trial. Connect your tools or upload a file, ask a question in plain English, and see how cross-system querying works with your own data. Try AnalysisGPT free.