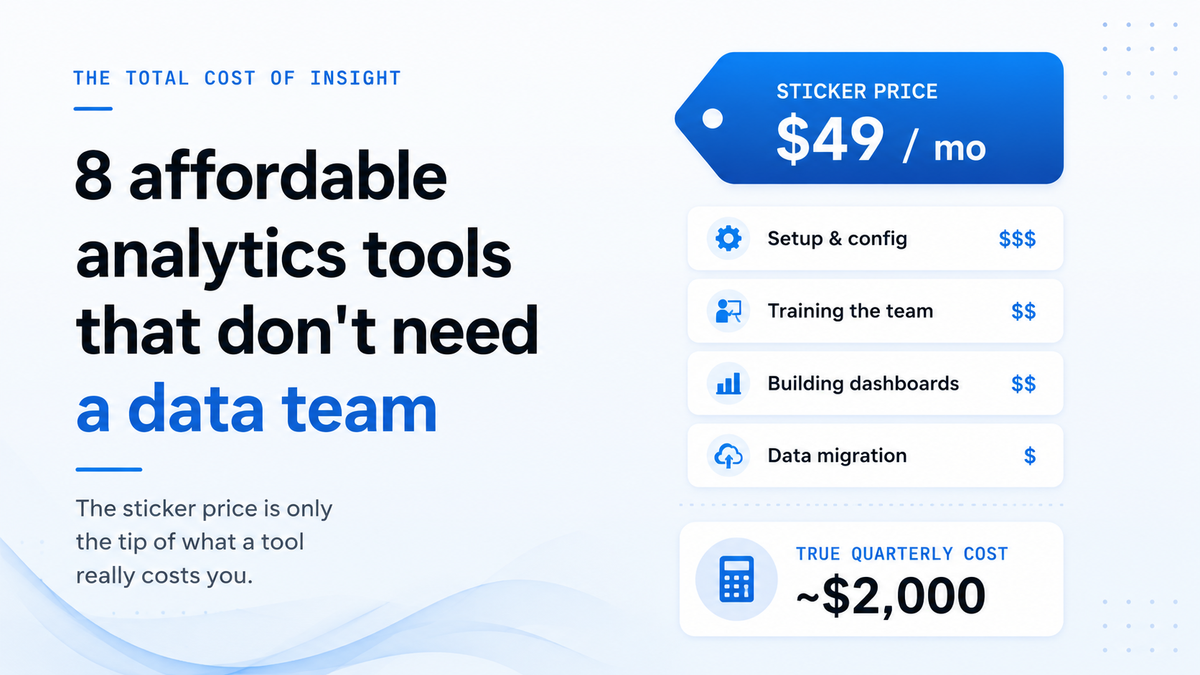
Most "affordable analytics" lists rank tools by sticker price alone, but subscription cost is only a fraction of what small teams actually spend to get answers from their data. The gap between buying a tool and pulling your first insight eats up hours of setup, training, and troubleshooting. Gartner estimated in 2020 that poor data quality costs organizations an average of $12.9 million per year. Scale that pattern down to a five-person team, and even modest inefficiencies add up fast.
Call it the "total cost of insight." Every analytics tool carries a hidden price tag: the time your ops lead spends learning a new interface, the freelancer you hire to build a dashboard, the week lost migrating data between formats. A $49 monthly subscription becomes a $2,000 quarterly expense once you factor in the labor around it.
We evaluated eight tools through that lens. Price still matters, but we also measured time-to-first-answer, required technical skill, and ongoing maintenance load. Each pick on this list can deliver usable insights within a week, without hiring a data analyst or learning SQL. Some are free. Some use AI to skip the setup curve entirely. All of them respect the reality that small teams can't afford to spend more time configuring a tool than using it.
Key takeaways
- Price range: Monthly costs span from free to $160, with most tools offering a usable free tier or trial period.
- Skill floor: Every tool on this list works for non-technical operators. None require SQL, Python, or a dedicated analyst.
- AI-powered analytics: A newer category of tools uses conversational AI to generate reports and answer questions in plain language, cutting setup time significantly.
- Fit over features: The best tool for your team depends on your data sources, team size, and how often you need answers. A cheaper tool that takes three weeks to configure costs more than a pricier one that works on day one.
- Free tiers exist, but read the limits: Several tools offer generous free plans, though storage caps, user limits, or export restrictions may push growing teams toward paid tiers within a few months.
What to look for in an affordable analytics tool
Setup time, learning curve, and technical requirements matter as much as subscription price when choosing an analytics tool. A tool that costs $20 per month but takes three weeks and a contractor to configure is more expensive than one at $50 that works on day one. These three criteria separate the tools that save money from the ones that just look cheap.
Time to first answer
The most useful measure of an analytics tool is how fast a non-technical user can move from signup to a real business insight. Feature lists don't capture this. A platform with 200 chart types means nothing if your ops lead needs two weeks of training before building the first one.
Setup complexity drives this metric more than anything else. Some tools require a data engineer to write SQL queries, build schemas, and configure dashboards before anyone else can touch them. Others let you drag in a CSV or connect a Google Sheet and start asking questions in minutes. The difference can be days versus hours.
Look at the onboarding experience with fresh eyes. Can a new user complete a meaningful task during their first session? Does the tool offer templates, guided workflows, or plain-language interfaces that reduce the learning curve? A steep ramp-up means your team burns hours learning software instead of reading the data it produces. For a five-person team, every extra hour of training multiplies across the whole group.
Data connections that match your stack
An analytics tool earns its price only when it connects to the systems your business already runs on. Shopify, QuickBooks, Google Sheets, HubSpot, a PostgreSQL database. The data lives in those places, and moving it manually defeats the purpose of buying a tool at all.
Pay attention to the type of connection each tool offers. Native connectors pull data automatically and stay in sync. Third-party middleware (like Zapier or Fivetran) adds another subscription and another layer of maintenance. File-upload-only tools put the burden on your team to export, clean, and re-import data on a regular schedule.
Native connectors: Built into the tool, automatic syncing, minimal setup.
Middleware connectors: Require a separate paid service, added configuration, potential sync delays.
Upload only: Manual effort every time data changes, no live connection.
The cheapest tool on your shortlist that doesn't connect to your actual data sources is not cheap. It's a monthly charge for software nobody will use after the first week.
Cost at your team size
Per-user pricing punishes growing teams. A tool at $15 per seat looks affordable for three people but costs $180 per month once your team hits 12. Flat-rate plans cap the cost regardless of headcount, which makes budgeting simpler and scaling painless.
Free tiers deserve skepticism. Most cap the value in ways that matter: 1,000 rows of data, one user, two connectors, or 30-day data retention. A free plan that limits you to a single data source won't survive contact with a real business question that spans sales and marketing data.
Hidden costs catch teams off guard. Watch for paid connector add-ons, storage overages, per-query charges, and premium support tiers. Some platforms advertise a low starting price but charge $30 per month for each additional database connection. Others meter API calls or charge for historical data beyond 90 days. Add those line items up before comparing sticker prices.
8 affordable analytics tools compared
1. AnalysisGPT
Who it works for: SMB founders and operators who want answers from their business data without SQL, dashboards, or a data team.
Best for analyzing: Cross-source business data from connected tools and uploaded files in plain English.
AnalysisGPT is a conversational analytics platform built for non-technical SMB operators. It connects directly to the tools businesses already use, lets anyone ask questions in plain English, and returns clear, trustworthy answers. No SQL. No ETL. No data team needed. The platform was built for the 50-person company with five data sources and no data team. You connect a database, upload an Excel or CSV file, or plug in a native Shopify connector, and start asking questions in everyday language. QuickBooks and Square integrations are currently in progress.
Key features and functions:
- Ask questions about your business data in plain English across connected sources and uploaded files
- Connect databases, upload Excel/CSV files, or use the native Shopify connector
- The AI model sees only your data schema (table names, column names, and types) but never the actual data. A separate read-only connection executes the model-written query against your system
- SOC 2, ISO 27001, ISO 42001, and GDPR compliant
- Get answers as charts, tables, or plain-language summaries without building dashboards
AnalysisGPT works best when your data lives in supported sources. QuickBooks and Square connectors are still in progress, so teams relying on those tools today will need to export files manually in the interim. Larger enterprises with complex data modeling needs or dozens of concurrent analysts may also want to evaluate the Enterprise tier for custom configuration.
Pricing: Trial at £0 gives a time-limited Pro experience. The Excel plan costs £20 billed every 30 days for file-based analysis. Pro costs £90 billed every 30 days and adds connected-source analysis on top of file uploads. Enterprise pricing is custom. All prices are in GBP.
Try AnalysisGPT free. Upload an Excel file and ask your first question in minutes.
2. Zoho Analytics
Who it works for: SMBs in the Zoho ecosystem or needing affordable BI with broad SaaS integrations.
Best for analyzing: Marketing, sales, and finance data across 50+ connected business apps.
A strong option for teams already running on Zoho products, Zoho Analytics offers a free tier that includes two users, 10,000 rows, and unlimited reports. The platform connects to Salesforce, HubSpot, QuickBooks, Xero, Shopify, and 50+ other business apps, making it one of the more connector-rich tools at the lower end of the pricing spectrum. You can build dashboards, schedule reports, and share them with teammates without writing code.
Key features and functions:
- Free tier with two users, 10,000 rows, and unlimited reports
- 50+ pre-built connectors for popular SaaS tools including Salesforce, HubSpot, QuickBooks, Xero, and Shopify
- Drag-and-drop report builder with scheduling and sharing
- AI assistant Ask Zia for natural-language queries (Premium tier and above)
- Embeddable dashboards and white-label options on higher plans
Ask Zia, the AI query assistant, is locked to the Premium (115/mo)andEnterprisetiers.TeamsontheBasicplan(24/mo) are limited to just two app connectors, while the Standard plan ($48/mo) opens up 50+ connectors. Dashboard building carries a learning curve, especially for users with no prior BI experience.
Pricing: Free tier (2 users, 10K rows). Basic at $24/mo (2 connectors). Standard at $48/mo (50+ connectors). Premium at $115/mo (includes Ask Zia).
3. Looker Studio
Who it works for: Marketing teams and small businesses heavily using Google products.
Best for analyzing: Google Analytics, Google Ads, and BigQuery data through free visual reports.
Google's free reporting tool punches above its price tag for teams already invested in the Google ecosystem. Looker Studio offers unlimited reports and users at no cost, and it connects natively to Google Analytics, Google Ads, BigQuery, and Google Sheets. You can drag data into visual reports, share them with your team via a link, and set up automated refreshes.
Key features and functions:
- Completely free core product with unlimited reports and users
- Native connectors for Google Analytics, Google Ads, BigQuery, and Google Sheets
- 1,300+ community connectors for non-Google data sources (many require separate payment)
- Shareable, interactive reports with scheduled email delivery
- Pro tier available at $9/user/project/month for additional collaboration features
Non-Google data sources often require paid third-party connectors, and costs can add up quickly when you need several. Looker Studio does not include a built-in AI query assistant, so every report requires manual configuration. Visualization options are more limited than enterprise BI tools, with fewer chart types and less granular formatting control.
Pricing: Free for the core product. Pro at $9/user/project/month. Third-party connectors priced separately.
4. Power BI
Who it works for: Businesses standardized on Microsoft tools (Office 365, Teams, Azure).
Best for analyzing: Enterprise-scale data with advanced modeling, especially in Microsoft-heavy environments.
Microsoft's BI platform brings serious data modeling capabilities to teams that already live in Excel, Teams, and Azure. Power BI Desktop is free to download and lets you build reports locally, though sharing those reports online requires at least a Pro license. The tool handles large datasets well and integrates deeply with the rest of the Microsoft stack.
Key features and functions:
- Free Desktop application for building reports locally
- Pro license at $14/user/month (billed yearly) for online sharing and collaboration
- Premium Per User at $24/user/month for advanced AI features, larger datasets, and paginated reports
- Pro license included in Microsoft 365 E5 subscriptions
- Deep integrations with Excel, Azure, Teams, and the broader Microsoft ecosystem
Power BI delivers its full value within the Microsoft ecosystem. Teams not standardized on Microsoft tools may find the integrations less useful. The Desktop app requires local installation rather than running entirely in a browser. Non-technical users often face a learning curve with data modeling concepts like relationships, DAX formulas, and data refresh schedules. Per-user pricing also means costs scale linearly with team size.
Pricing: Desktop is free (local only, no sharing). Pro at $14/user/month billed yearly. Premium Per User at $24/user/month. Pro included with Microsoft 365 E5.
5. Julius AI
Who it works for: Individual analysts and small teams wanting AI-first analytics without dashboard building.
Best for analyzing: Uploaded datasets (CSV, Excel) with natural language questions and AI-generated charts.
Julius AI turns uploaded spreadsheets into answers through a chat interface. You drop in a CSV or Excel file, ask a question in plain English, and the platform generates charts, summaries, and statistical analysis without any manual formula work. The approach works well for one-off analysis tasks where building a full dashboard would be overkill. Small teams running quick experiments or solo analysts exploring datasets can get to insights in minutes rather than hours.
Key features and functions:
- Chat-based interface that generates charts and analysis from natural language prompts
- Supports CSV and Excel file uploads on all plans, including the free tier
- Plus plan at $20/mo and Pro plan at $45/mo add more monthly credits and advanced AI models
- Business plan at $450/mo unlocks direct database connectors for Snowflake, BigQuery, and PostgreSQL
- AI-generated code you can inspect behind every analysis
Database connectors stay locked behind the Business tier at $450/mo, so teams needing live connections to production systems face a steep jump in cost. The free tier offers very limited credits in practice, and the credit-based model means heavy users burn through their allowances quickly. Julius AI works best as a file-based analysis tool. Live connections to business systems like CRMs or accounting platforms require that expensive top tier, which puts it out of reach for most SMBs.
Pricing: Free tier with limited credits. Plus at $20/mo, Pro at $45/mo, Business at $450/mo with database connectors.
6. Metabase
Who it works for: Dev-savvy SMBs and startups with their own databases who want self-hosted analytics.
Best for analyzing: Database data (PostgreSQL, MySQL, MongoDB, BigQuery, Snowflake) through a visual query builder.
Teams with existing database infrastructure can run Metabase's open-source edition for free on their own servers, with no user limits and no license fees. The visual query builder lets non-SQL users drag and drop their way to charts and dashboards, while SQL-comfortable team members can write custom queries directly. More than 20 database connectors ship out of the box, covering the major relational, NoSQL, and cloud data warehouse options.
Key features and functions:
- Open-source Community Edition with unlimited users at no cost
- Visual query builder for creating charts without writing SQL
- 20+ native database connectors, including PostgreSQL, MySQL, MongoDB, BigQuery, and Snowflake
- Embeddable dashboards for internal tools and customer-facing portals
- Role-based permissions and row-level data sandboxing for team access control
The free tier requires self-hosting, meaning your team needs a server and someone comfortable maintaining it. Metabase connects to databases rather than SaaS apps like Shopify, QuickBooks, or HubSpot, so teams pulling data from those tools will need to move it into a database first. Cloud-hosted plans start at $100/mo plus $6 per additional user beyond the five included, which adds up for larger teams. Metabase fits best when your data already lives in a database and your team has enough technical comfort to manage infrastructure.
Pricing: Open-source self-hosted edition is free with unlimited users. Starter Cloud at $100/mo with five users included, plus $6 per additional user.
7. Databox
Who it works for: Marketing teams, agencies, and SMBs consolidating metrics from multiple SaaS tools.
Best for analyzing: SaaS platform metrics (HubSpot, Google Analytics, Facebook Ads, Salesforce, Shopify).
Marketing teams juggling five or six SaaS tools can pull all their KPIs into a single Databox dashboard without writing code. The platform offers 130+ one-click integrations with popular cloud apps, so connecting a HubSpot account or Google Analytics property takes minutes. Pre-built dashboard templates and a drag-and-drop builder make it easy to get a consolidated view of campaign performance, revenue metrics, and funnel data across platforms.
Key features and functions:
- 130+ native integrations with SaaS platforms including HubSpot, Google Analytics, Salesforce, and Shopify
- Free tier with 3 data sources, 1 dashboard, and 3 users
- Pre-built dashboard templates for common marketing and sales KPIs
- Goal tracking and automated performance alerts
- Mobile app for checking metrics on the go
The Pro plan at $159/mo is a significant jump from the free tier, and teams that only need basic dashboards may find it hard to justify. Free accounts are limited to three data sources and daily data syncing only, which makes the free tier more of a trial than a working plan. Databox focuses on consolidating SaaS metrics rather than querying databases or analyzing raw datasets. Teams that need to explore CSV files or run SQL queries may find a better fit elsewhere.
Pricing: Free tier with 3 data sources and 1 dashboard. Pro at $159/mo.
8. KNIME
Who it works for: Data scientists and technical analysts needing advanced data processing without license costs.
Best for analyzing: Complex data pipelines, ETL workflows, and machine learning models through a visual workflow builder.
KNIME gives data scientists a full visual workflow builder for data processing, machine learning, and ETL pipelines at no cost on desktop. You build analysis workflows by dragging nodes onto a canvas and connecting them, covering everything from data cleaning to predictive modeling. The platform ships with 300+ connectors for databases, cloud services, and file formats, making it one of the most flexible open-source analytics tools available.
Key features and functions:
- Free open-source desktop application with unlimited local use
- Visual drag-and-drop workflow builder for data pipelines, ETL, and machine learning
- 300+ data source connectors covering databases, APIs, cloud storage, and file formats
- Built-in machine learning nodes for classification, regression, clustering, and text mining
- Community Hub with thousands of shared workflows and components
KNIME's learning curve is steep. The platform was built for data scientists and analysts with technical backgrounds, and non-technical users will struggle with the workflow paradigm. Even experienced analysts need time to learn the node library and workflow logic. The visual builder is powerful but can feel overwhelming compared to simpler dashboard tools. KNIME is overkill for teams that just need ad-hoc charts or basic reporting. It fits best when your analysis requires multi-step data transformations, statistical modeling, or repeatable pipelines.
Pricing: Free open-source desktop edition. Pro cloud at $19/mo with 120 execution credits. Team at $99/mo for businesses under 50 employees, with 3 users included.
How to choose the right tool for your business
The best analytics tool is the one your team actually uses every week. Picking the wrong fit leads to shelfware and wasted budget. Two factors matter most: how your data lives today and who on your team will run the analysis.
Match the tool to your data
Analytics tools split into two camps: file-based and connected-source. File-based tools let you upload a CSV or Excel file for one-off analysis. Connected-source tools pull live data from your business systems automatically.
File-based works well for a quick look at last quarter's sales numbers. Connected-source tools matter more when you ask the same operational questions every week. A tool that connects directly to your Shopify store or QuickBooks account saves hours of exporting and reformatting.
Looker Studio is a strong fit for teams already inside the Google ecosystem. Power BI connects natively to Microsoft data sources like Azure SQL and Dynamics 365. Smaller ecommerce and accounting teams should look for tools with built-in Shopify, QuickBooks, or Xero connectors so data flows in without manual uploads.
Factor in the team you have
Technical teams can self-host Metabase or build custom workflows in KNIME. Both are powerful, free, and open source. Both also require someone comfortable with configuration, database queries, or visual programming.
Non-technical teams need a different path. Pre-built dashboards and drag-and-drop interfaces help, but they still assume some comfort with data modeling. AI-powered conversational analytics tools lower the skill floor further by letting users ask questions in plain English instead of building charts from scratch. AnalysisGPT connects directly to business tools and lets anyone ask questions in plain English. Tools like these remove the gap between having data and getting answers, especially for teams without a dedicated analyst.
Frequently asked questions
Is a free analytics tool good enough for a small business?
Free tiers work for basic monitoring, but most hit limits fast on row counts, user seats, or data connectors. Growing teams typically outgrow free plans within a few months and end up needing a paid tier for the features they rely on daily.
Can AI analytics tools replace traditional BI platforms?
AI analytics tools handle ad-hoc questions and day-to-day operational insights well. Traditional BI platforms still have advantages for complex data modeling, governed reporting, and enterprise-scale deployments. The right choice depends on what kind of questions your team asks and how often they need answers.
How much should a small business spend on analytics tools?
Most SMBs can get meaningful analytics for $20 to $100 per month. Free tiers are a good starting point to test whether a tool fits your workflow. Factor in hidden costs like per-connector fees, per-user pricing, and the time your team spends learning a new interface.
Do I need Power BI if my business is small?
Power BI Pro at $14 per user per month is affordable per seat, but costs add up with team size. Small businesses outside the Microsoft ecosystem may find simpler, purpose-built tools more practical than configuring Power BI's full feature set.
What is the cheapest way to analyze business data?
Looker Studio (free) is the strongest option for Google ecosystem data. Metabase (free, self-hosted) works well for teams with database access and some technical comfort. AnalysisGPT Trial (free) offers conversational analysis of connected sources or uploaded files without requiring technical setup.
Can I switch analytics tools without losing my data?
Your source data stays in its original systems: databases, SaaS tools, and spreadsheets. Switching analytics tools means reconnecting those sources and rebuilding any saved reports or dashboards. The underlying data doesn't move or disappear. Budget one to two weeks for a typical migration, depending on how many reports you need to recreate.
Insight you act on beats a lower price tag
Affordable analytics tools have made data access a solved problem for small teams. The eight options above prove that budget constraints and technical skill gaps no longer justify flying blind on revenue, retention, or operational efficiency. Yet the tool that saves your business the most money is the one your ops lead, founder, or marketing manager opens on Monday morning and actually uses to change a decision. A dashboard nobody checks costs more than a platform with a higher price tag that surfaces an answer before the weekly meeting.
The most affordable analytics tool is the one your team uses to make better decisions, not the one with the lowest sticker price.